Research & Reviews: Journal of Material Sciences
ISSN:2321-6212
ISSN:2321-6212
Ministry of Education, Educational Directorate of Babylon, Iraq
Received date: 07/06/2017; Accepted date: 12/06/2017; Published date: 20/06/2017
DOI: 10.4172/2321-6212.1000172
Visit for more related articles at Research & Reviews: Journal of Material Sciences
Two Schiff bases ligands (liquid crystals) have been prepared from benzidine. The texture diagnosed by optical microscopy of polarizing light (POM) technique, these ligands have nematic phase (Enantiotropy Phase), then characterized multi physic-chemical techniques such as (UV-Visible, IR, XRD and CHN). The results show that the type of textures was marble at heating and schleiren at cooling for all ligands. Ligands have polycrystalline structure and take square planar with crystalline size in nano dimension.
LCMs, POM, XRD and Schiff basses
Liquid Crystals Materials (LCMs) are mesophase pomp equivocation between profound and clear nation. It is mostly assemble a mesomorphic plight which is nation of moment in which the gradation of brownian arrangement is intervene between the three dimensional, belong-wander mealy and orientation attitude found in grave crystals and the destitution of hunger-sift direction found in isotropic liquids, gases, and uncrystallized compact [1].
LCMs are finding rhythmical applications that of their ability to veer orientation of molecules in answer to very soft physical and alchemical humor, such as electromagnetic fields, surface modifications and pressure gradients [2].
Test the powder of materials in X-ray diffraction (XRD) technique is one of the primary techniques used by mineralogists and grave pomp physics to explore the internal structure of unknown or new prepared materials. Diffraction archetype fetters complaint on translational radiism-size and regulate of the one cell from point positions and intelligence on electron compactness indoors the one amoeba, namely where the atoms are set from culminate Intensities [3,4], a crystal structure (usual granulate gauge) has been fitted second-hand Debye-Scherrer formula [5,6]:
 (1)
(1)
Spacing between crystalline planes (d) calculated by Bragg equation [6]:
nλ=2d sinθ (2)
Where: (λ) wavelength of XRD (0.15407 nm), (β) (Full Width at Half Maximum in radiant), (θ) angle of diffraction, (Gs) grain size, (n) integer number represent the reflection ordering.
Physical Measurements
Liquid pellucid properties were perscrutate by (POM) worn a Leitz Laborlux 12 pols attached to a Linkam with hasty level and digital camera. Electronic spectra of the ready compose were graduated in the country (200-1100) nm for (1×10 −3) M solutions in arbitrary ethanol at (28°C) using a Broker spectrophotometer matched quartz cell. Structural properties of ligands were diagnosed by XRD patterns. Molar conductivity measured in by using a (DDS-307W) conductivitymeter at RT. Melting points (M.P.) measured by SMP-30 capillary device.
Procedures of Synthesis
Ligands were prepared using a method previously reported in the literature [7].
Benzidine (bislacetylace tlydine) (K1)
Benzidine (bislacetylace tlydine) prepared by mixed (1.78 g; 0.013 mol) of benzidine that dissolved in (10 mL) from ethanol in absolute state then added (3 drops) of glacial acetic acid to the mixture. The reaction was refluxed for 3 hrs, resulted transparence orange product. The resulted crystal was filtered then washed by absolute ethanol repeatedly and re-crystallization was made by same solvent.
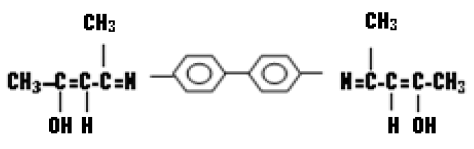
Benzidine Bis (Propayldine) (K2)
Benzidine bis (propayldine) was prepared by mixing (3.56 g; 0.01 mol) of benzidine dissolved in 10 mL of absolute ethanol, then added to the prepared mixture three drops of glacial acetic acid. Reaction intermixture was refluxed for 3 hours, inference sensational profound result. The producted crystal filtered and washed by the same method in (3.2.1) (Table 1).
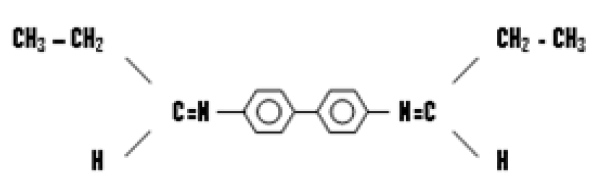
Table 1. Molar Conductivity and M.P. of LCs Ligands.
| No. | Compounds formula | Compound symbol | Compounds color | M.P. °C | Λ *10-3 Ω-1 mol-1 cm2 |
|---|---|---|---|---|---|
| 1 | C22H24O2N2 | K1 | Orange | 270.3 | 126.4 |
| 2 | C14H20N2 | K2 | Yellow | 165 | 124.6 |
Texture Properties
From the images of (POM) test, it’s a clear that the nematic liquid crystal phase appear in two cases (heating and cooling) but in different form, where in heating state take (marble) form, but (schleiren texture) form in distinct separation droplets grow. Because of appear nematic LC phases in two cases, this is called (Enantiotropic LC phases) [8]. Figure 1 below shows that the photographic image of (K1) ligand in two cases. So the reason of appear enantiotropic nematic LC phase return to found four aromatic rings in the chemical structure in addition of the nitrogen atoms assist the molecule by its length and hardness, so the continuous change in electronic positions on the length of molecules the led to increase the attractive forces (polarization) [9].

Figure 1: Enantiotropic LC Phase of Ligand (K1).
Optical Spectroscopic
The two bands that appear in (UV-Vis) spectrum of these two ligands showed two bands at (352.50) nm wavelength assigned to (n→π*) and (293.00) nm wavelength assigned to (π→π*) [10]. While the UV-Visible absorbance were (0.365-0.398) (Figures 2 and 3).

Figure 2: UV-Visible Spectra of Ligand (K1).

Figure 3: UV-Visible Spectra of Ligand (K2).
IR Analysis
The test of IR analysis is used to know the happen of chemical interaction or no by wave factor shifting and compare with original charts. The ligands (K1 and K2) shows intense absorption at (1627.89 and 1612.38) cm-1 to refer to (C═N) azomthine group in plane streaching vibration, and (1189.08 and 1028) cm-1 for aromatice groups (C-H) this group is active [11-13], also (1600 and 1554.52) cm-1 which may be assigned to (C═C) plane stretching vibration. Figure 4 exhibits a band absorption of (K1 and K2) of ligand respectively. Main characteristic of IR absorption bands of ligands are presented in Table 2.

Figure 4: IR Spectra of (K1) and (K2) Ligands
Table 2. IR Characteristic Bands Frequencies (cm−1) of the Ligands.
| No. | Symbol | C=C Stretch | (C=N) Stretch | (M‒N) Stretch |
|---|---|---|---|---|
| I | K1 | 1607 | 1627.89 | ― |
| II | K2 | - | 1612.38 | ― |
Structural properties
The crystal structure of compounds has been examined by (XRD) spectrum. Each compounds (K1 and K2) have polycrystalline structure. The (Gs) has been theoretically calculated by equation (1), so the values lying in the range between (12-61) nm. Figure 5 represent (XRD) pattern of (K1) ligand.

Figure 5: XRD pattern of (K1) compound.
Molar conductance measurements
The measurements of Molar conductivity measurements for all complexes in DMF solvent by the ratio (1:1) have been measured. The values lying in the range between (25.7–124.5) (cm2/Ωmol) to refer that electrolytic solution has been prepared [14]. This result indicates to the effect of addition and the response of chloride ions to transfer the charges, as a clear in Table 1.
CHN analysis
From CHN analysis, we concluded the chemical interaction is true. There is a good agreement between the theoretical and practical of C, H and N values, so the Table 3 shows that theoretical and experimental CHN values.
Table 3. Comparative of CHN Values.
| Compound | Molecular Formula | Practical | Theoretical | ||||
|---|---|---|---|---|---|---|---|
| N% | H% | C% | N% | H% | C% | ||
| K1 | C22H24O2N2 | 71.25 | 6.83 | 8.66 | 75.83424 | 6.94257 | 75.83424 |
| K2 | C14H20N2 | 38 | 6.99 | 11.2 | 37.7313 | 7.31888 | 37.7313 |
i. The Enantiotropy liquid crystal phases appear in two cases for all compounds.
ii. K2 has two different bands gaps.
iii. No chemical interaction (lower K factor).
iv. (K1 and K2,) have polycrystalline structure.
v. The resulted electrolytic is intrinsic organic semiconductor with square planar.
vi. CHN shows that a good agreement between theoretical and practical values.