Research & Reviews: Journal of Veterinary Sciences
e-ISSN No.:2581-3897
e-ISSN No.:2581-3897
Mina Rahbar*, Roghieh Safari
Department of Fisheries and Environmental Sciences, Gorgan University of Agricultural Sciences and Natural Resources, Gorgan, Iran
Received: 27-Jul-2024, Manuscript No. JVS-24-143356; Editor assigned: 30-Jul-2024, Pre QC No. JVS-24-143356 (PQ); Reviewed: 13-Aug-2024, QC No. JVS-24-143356; Revised: 05-Jan-2025, Manuscript No. JVS-24-143356 (R); Published: 12-Jan-2025, DOI: 10.4172/2581-3897.9.1.001
Citation: Rahbar M, et al. Participatory Approaches to Derive Consensus on Desired Genetic Gains for Rainbow Trout Breeding Objective in Iran. RRJ Vet Sci. 2025;9:001.
Copyright: © 2025 Rahbar M, et al. This is an open-access article distributed under the terms of the Creative Commons Attribution License, which permits unrestricted use, distribution and reproduction in any medium, provided the original author and source are credited.
Visit for more related articles at Research & Reviews: Journal of Veterinary Sciences
The Rainbow trout (Oncorhynchus mykiss) is one of the most important farmed fish in Iran, which holds high economic value as a source of meat. The purpose of this study was to define desired genetic gains for the important traits of this fish using an analytic hierarchy process and a weighted goal programming. Therefore, two questionnaires were sent out to 174 trout farmers in Iran. The first questionnaire included management factors and farming environments. In this questionnaire, farmers were asked to choose 6 important traits in rainbow trout among 14 economic traits for genetic improvement. In the second questionnaire, priorities of the 6 traits with the highest value were obtained using pair-wise comparison. The results showed that the 6 most important traits were Feed Conversion Ratio (FCR), Thermal Growth Coefficient (TGC), Harvest Weight (HW), Uniformity (U), Late Maturity (LM) and Deformity (D). Medians of the best individual preference values were FCR (0.29), TGC (0.24), HW (0.17), LM (0.13), U (0.09) and D (0.06). Most disagreements were found between the social group preference values in the water temperature, commercial products and water source categories. Desired genetic gains were 2.25, 1.43, 1.20, 1.04, 0.38 and 0.03% for FCR, LM, TGC, HW, D and U respectively. Consensus preferences can be used to obtain a single compromise breeding objective for situations where the same genetic resources are produced under different environmental and management conditions.
Breeding program; Desired genetic gains; Salmonids; Farmers; Participatory approaches
Rainbow trout (Oncorhynchus mykiss) is the most important cold-water-farmed fish in Iran. There are several populations of it in the world and Iran, which are either supplied from reproductive farms in the country or imported from different countries as eyed eggs. This species is produced in different conditions such as cultural environments or farm management systems (e.g., fry, pan-sized fish, large rainbow trout, or fillet). Regarding O. mykiss culture in Iran, conducting research on its breeding program is of high value.
Currently, only about 10% of the world's aquaculture production is based on genetically improved fish [1], although this ratio is expected to increase with the intensification of aquaculture [2]. The design of a breeding program in aquaculture aims to produce populations with enhanced characteristics. The first basic step in a breeding program is determining which traits should be genetically improved. Participatory approaches are a method for determining a breeding objective and rank for a set of traits [3]. The Analytic Hierarchy Process (AHP) and Weighted Goal Programming (WGP) are analytical tools for the participatory approach. The analytic hierarchy process organizes and analyzes complex decisions [4,5]. This analysis is a measurement theory that uses a pair-wise comparison based on the judgments of experts using a priority scale [6]. Finally, it is used to calculate individual preferences for attributes [7-9]. Next, individual preferences are aggregated to group preferences using WGP [10]. When groups differed in opinion, WGP-based models (extended WGP) can be used to construct consensus preference values. The participatory approach was used by integrating the AHP, WGP, and extended WGP methods by Sae-Lim et al. to define the desired genetic gains for rainbow trout breeding objectives. In a similar study on Nile tilapia (Oreochromis niloticus) and Pacific white shrimp (Litopenaeus vannamei) the desired genetic gains were obtained by method. For this, we applied to Iranian trout farmers the data collection and analysis approach initially developed by Sae-Lim et al. for rainbow trout desired gains at the world level.
Data collection
Farmer databases were randomly selected with the advice of the Fisheries Department of provinces. An inquiry of trout farmers was conducted using a set of pretested structured questionnaires and personal interviews. This survey was used for all provinces of Iran (except for Bushehr (28.7621°N, 51.5150°E) and Hormozgan (27.4150°N, 56.7412°E) provinces in the south of Iran, which did not have trout farms).
Our method was described following the previous study by Sae-Lim et al. For this purpose, we used two questionnaires and shared them with 174 private trout farmers (6 farmers in each province). The first questionnaire collected common information on the rainbow trout farm and ranked the 6 most preferred traits out of 14 traits (Table 1) that farmers would like to improve, as a percentage (from 0 to 100%). Figure 1 shows the ranking traits from the first questionnaire. The 7 highest ranked traits were FCR, Thermal Growth Coefficient (TGC), disease resistance, Harvest Weight (HW), Uniformity (U), Late Maturity (LM), and Deformity (D). Disease resistance was ranked the third, but due to the presence of various diseases, it was not examined in the second questionnaire. In the second questionnaire, 15 pair-wise comparison questions (6 × (6-1)/2=15) were made for 6 highest valued traits with scales ranging from 1 to 9. A score of 1 showed equal preference, while a score of 9 displayed that the selected trait is preferable over the other (Table 2).
| Trait | Definition |
| Thermal growth coefficient | It is a type of measurement of growth rate that independent of water temperature |
| Condition factor | It shows the appearance of the body shape in fish |
| Fillet percentage | Defined as the ratio of fillet weight and ungutted weight |
| Feed conversion ratio | The amount of feed it takes to grow a kilogram of fish |
| Flesh redness | It expresses the color of the meat |
| Skin color and spottiness | Trout can differ from silver to brown, blue, or green and spotless to fully spotted |
| Slendershape | It shows the rearing of slender trout |
| Harvest weight | Fish weight at harvest |
| Uniformity | The similar size of the fish body weight and length in harvest |
| High water temperature tolerance | Upper thermal tolerance than optimum water temperature (exceed 2°C) |
| Low water temperature tolerance | Lower thermal tolerance than optimum water temperature (less than 4°C) |
| Deformity | It is usually caused by a disturbance of bone structure |
| Late maturity | It means a delay in the first age of maturation |
| Disease resistance | The ability of a fish to prevent or increase withstand the infection |
Table 1. Traits in the initial questionnaire and their definitions.

Figure 1. Ranking traits used in the first questionnaire.
| Trait | Scale | Trait |
| 7.76% less feed conversion ratio | 9 8 7 6 5 4 3 2 1 2 3 4 5 6 7 8 9 | 4.15% faster thermal growth coefficient |
| 7.76% less feed conversion ratio | 9 8 7 6 5 4 3 2 1 2 3 4 5 6 7 8 9 | 5.76% greater harvest weight |
| 7.76% less feed conversion ratio | 9 8 7 6 5 4 3 2 1 2 3 4 5 6 7 8 9 | 0.26% greater uniformity |
| 7.76% less feed conversion ratio | 9 8 7 6 5 4 3 2 1 2 3 4 5 6 7 8 9 | 14.3% later late maturity |
| 7.76% less feed conversion ratio | 9 8 7 6 5 4 3 2 1 2 3 4 5 6 7 8 9 | 6.4% less deformity |
| 4.15% faster thermal growth coefficient | 9 8 7 6 5 4 3 2 1 2 3 4 5 6 7 8 9 | 5.76% greater harvest weight |
| 4.15% faster thermal growth coefficient | 9 8 7 6 5 4 3 2 1 2 3 4 5 6 7 8 9 | 0.26% greater uniformity |
| 4.15% faster thermal growth coefficient | 9 8 7 6 5 4 3 2 1 2 3 4 5 6 7 8 9 | 14.3% later late maturity |
| 4.15% faster thermal growth coefficient | 9 8 7 6 5 4 3 2 1 2 3 4 5 6 7 8 9 | 6.4% less deformity |
| 5.76% greater harvest weight | 9 8 7 6 5 4 3 2 1 2 3 4 5 6 7 8 9 | 0.26% greater uniformity |
| 5.76% greater harvest weight | 9 8 7 6 5 4 3 2 1 2 3 4 5 6 7 8 9 | 14.3% later late maturity |
| 5.76% greater harvest weight | 9 8 7 6 5 4 3 2 1 2 3 4 5 6 7 8 9 | 6.4% less deformity |
| 0.26% greater uniformity | 9 8 7 6 5 4 3 2 1 2 3 4 5 6 7 8 9 | 14.3% later late maturity |
| 0.26% greater uniformity | 9 8 7 6 5 4 3 2 1 2 3 4 5 6 7 8 9 | 6.4% less deformity |
| 14.3% later late maturity | 9 8 7 6 5 4 3 2 1 2 3 4 5 6 7 8 9 | 6.4% less deformity |
| Note: 1=equal, 3=moderate, 5=strong, 7=very strong 9=extreme, 2, 4, 6, and 8 are intermediate values between 2 scales | ||
Table 2. Pairwise comparison in second questionnaire.
For each trait, the hypothetical improvement expressed in % of the trait mean was given, which equals the change after one generation of phenotypic selection with a selection intensity of 1. For FCR, TGC, HW, uniformity, and deformity were estimated as i × h2 × CV, where i is the intensity of selection, h2 is the heritability and CV is the coefficient of phenotypic variation. To eliminate the scaling effect, the phenotypic standard deviation (σP) was substituted with CV (CV=σP/μP) in calculating the response to phenotypic selection, where μP is the phenotypic mean. Parameters were obtained from the literature (Table 3). For the binary trait (LM), genetic change was obtained based on, that selection was changing the underlying liability scale of a trait.
| Trait | h2 | CV | G% |
| Feed conversion ratio | 0.17 | 45.69 | 7.76% less |
| Thermal growth coefficient | 0.24 | 17.31 | 4.15% faster |
| Harvest weight | 0.23 | 25.07 | 5.76% greater |
| Uniformity | 0.013 | 20 | 0.26% greater |
| Late maturity | 0.18 | 14.3% later | |
| Deformity | 0.02 | 320 | 6.4 % less |
Table 3. Average heritability (h2), Coefficient of Variation (CV) and expected Genetic improvement (G%) for the 6 highest ranked traits.
Estimation of trait preference
Preference values were calculated on 3 different levels: Individual, social group and consensus level.
Estimation of individual preferences
Using the AHP, the Ind-P values for 174 farmers were analyzed in Super Decisions software (Saaty, 2003). The intensity of preferences was indicated as relative importance (aij) between the ith and jth traits (i, j=1, 2, 3..., 6) using a numerical scores 1-9 (Table 2). A 6 × 6 pair-wise comparison matrix (P), was constructed for each entry of the traits (aij). This matrix included upper, lower and diagonal elements, indicating the relative importance (aij), reciprocal relative importance (aij= 1/aij), and equal importance (ai=j=1), respectively. The eigenvector of the P matrix, corresponding to the maximum eigenvalue for each set of response from a farmer, was estimated. By normalizing the eigenvector (summed up to 1), Ind-p values were gained. The consistency ratio (CR) value was checked for all responses in the pairwise comparison matrix. If the CR is less than 0.1, the result of the judgment will be reliable. Otherwise, to obtain CR<0.1, the interview is repeated for respondents with CR>0.1.
Estimation of social group preferences
In this study, farmers were grouped based on their farming environment and management. The Social group preference (Soc-P) value was calculated separately for 5 categories (water temperature, commercial products, altitude, water source and water circulation) with different social groups.
For water temperature, 3 social groups were distinguished according to the average temperature of the trout farm in Iran: "low" including farms with water temperatures in the range of 12 to 16°C and minimum temperatures under 12°C; "high" containing farms with water temperatures in the range of 12 to 16°C and maximum temperatures above 16°C; "low and high" including farms with minimum water temperatures under 12°C and maximum water temperatures above 16°C. For commercial products, 4 social groups were identified: farmers who produce fish less than 100 g in size (≤ 100 g-sized), farmers producing pan-sized, farmers producing large fish, and finally farmers producing ≤ 100 g in size, pan-sized, and large rainbow trout (all-sized). Altitude was separated into 2 social groups: Producers at low-altitude (below 300 meters above sea level) and Producers at high-altitude (above 300 meters above sea level). Water source was compared in 4 social groups: farmers who used river, spring, well and aqueduct water. For water circulation, 2 social groups of farmers were investigated: farmers who used a flow-through system and farmers who used a water reuse system.
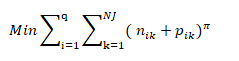
Using weighted goal programming (WGP; model 1), Ind-P values were combined in social groups. This approach minimizes the sum of individual disagreements.
The aim of the WGP is given as follows:
subject to Goals
Where q=number of traits in the breeding objective (q=6 traits); i=1 to 6 traits to be evaluated by j=1, 2,..., m social groups; NJ=number of members in the jth social group;

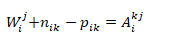
calculated from AHP of the ith trait judged by the kth member of the jth social group; Wij=Cumulative preference weight assigned to the ith trait by the jth social group; nik and pik are the negative and positive deviations of Aikj from Wij, respectively; and π=a parameter that represents a general metric. The weight related to the sum of deviation variables was determined as π=1. The solution is statistically defined by the median weight When π=1. Model (1) was carried out using LINGO computer software (LINDO Systems, Inc., Chicago, IL). By normalizing the Wij (summed up to 1), Soc-P values were obtained.
Estimation of consensus preferences
Consensus Preferences (Con-P) values in all respondents were calculated using extended WGP as the following function.
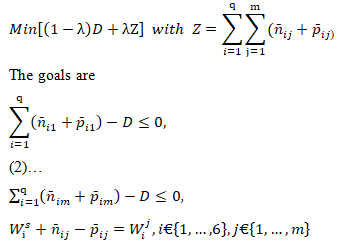
Where m=number of social groups; Wis=consensus weight related to the ith trait; (ni1+pi1)=the sum of the negative and positive deviations of the jth social group preference value from the Con-P value; D=the disagreement in each social group according to the consensus obtained; Z=the sum of the disagreements of categories.
The coefficient value λ determines the weight of the minority groups. When λ equals 0, π becomes infinity; therefore, model 2 defines the consensus by minimizing the disagreement of the most displaced group. When λ equals 1,λ equals 1; therefore, model 2 shows the consensus by median weights. Model 2 was solved with LINGO, with λ values ranging from 0 to 1.
Considering that the most disagreements between social group preference values were observed in water temperature, commercial products, and water source categories, consensus preference values were calculated for these categories. To get Con-P values in the above 3 categories, Ind-P values were randomly determined for 11 social groups (R1, ..., R11). Soc-P values were estimated and normalized using the model (1). Then, Con-P values were evaluated using extended WGP replicated 9 times.
Estimation of desired genetic gains
Desired genetic gains were calculated by multiplying genetic improvement (G%) with the mean Con-P values for water temperature, commercial products and water source categories.
The Loperamide® sample was prepared by dissolution of 2 mg Loperamidetabletsin 40 ml of distilled water.
Preference value estimation in rainbow trout farmers
Figure 2 shows the Ind-P value achieved from AHP. Medians were 0.29, 0.24, 0.17, 0.09, 0.13, and 0.06 for FCR, TGC, HW, U, LM, and D, respectively. According to the results, improvement in FCR and TGC were more preferable than improvement in other traits. However, there were large differences between individual farmers. There were a few extreme values found for uniformity, indicating that a few farmers strongly preferred this trait.

Figure 2. Box plot presenting the median (horizontal line within the box), interquartile range, extreme values (Y-bar error), and outliers (circle dots) for trait individual preferences obtained from AHP. FCR: Feed Conversion Ratio; TGC: Thermal Growth Coefficient; HW: Harvest Weight; U: Uniformity; LM: Late Maturity; D: Deformity.
Figure 3 (A-E) shows Soc-P value for categories. The Soc-P values on traits varied between water temperatures. Farmers using "low" and "low and high" temperatures indicated more preference for TGC, a moderate preference for HW and FCR, and a lower preference for U, LM and D. Farmers using "high" temperature showed a greater preference for FCR. Also for these farmers, the preference for LM was greater than U (Figure 3A).
There were differences in Soc-P values for commercial product groups. "≤ 100 g-sized" producers indicated a stronger preference for TGC and U, a moderate preference for FCR, HW, and, D, and a lower preference for LM. In contrast, "pan-sized" and "large fish" producers groups confirmed FCR followed by TGC, HW, and LM. In the "all-sizes" producers, the preference was similar to the "pan-sized and large fish" groups but for these producers, the preference for uniformity was slightly greater than LM.
Preference values for the water source category showed that river farmers indicated a stronger preference for TGC, a moderate preference for FCR, HW, and U, and a lower preference for LM and D. The Soc-P values for farmers using the spring, well, and aqueduct water showed a greater preference for FCR followed by TGC, HW and U and a lesser preference for LM and D (Figure 3C).
There were few differences in preference values for altitude and water circulation categories. At low-altitude farmers and reused water system in water circulation, TGC was taken into account more important than FCR, while the opposite was true for high-altitude farmers and flow through system (Figures 3D and E).

Figure 3. Social group preference values based on different categories. (A) Water temperature; (B) Commercial products; (C) Water source; (D) Altitude; (E) Water circulation. FCR: Feed Conversion Ratio; TGC: Thermal Growth Coefficient; HW: Harvest Weight; U: Uniformity; LM: Late Maturity; D: Deformity.
Consensus preferences and desired genetic gains of rainbow trout
Consensus preferences were calculated for the social groupings with the most disagreement in 3 categories (Table 4). In each category, a set of Con-P values with a blend of the lowest Z and Dmax shows the best consensus between the groups. The average of the best Con-P values were 0.29, 0.29, 0.17, 0.13, 0.10, and 0.06 for FCR, TGC, HW, U, LM and D.
| λ1 | Consensus preference2 | Social group disagreement | |||||||||
| FCR | TGC | HW | U | LM | D | D13 | D2 | D3 | D4 | Z4 | |
| Water temperature | |||||||||||
| [1.0, 0.33] | 0.2 | 0.32 | 0.18 | 0.13 | 0.1 | 0.06 | 0.07 | 0.32 | 0 | 0.4 | |
| [0.33, 0] | 0.26 | 0.26 | 0.18 | 0.13 | 0.1 | 0.06 | 0.2 | 0.2 | 0.13 | 0.52 | |
| [0.0] | 0.32 | 0.33 | 0.17 | 0.11 | 0.09 | 0.05 | 0.2 | 0.2 | 0.2 | 0.59 | |
| Commercial products | |||||||||||
| [1.0, 0.33] | 0.29 | 0.24 | 0.17 | 0.08 | 0.13 | 0.07 | 0.45 | 0.04 | 0.1 | 0.09 | 0.67 |
| [0.33, 0] | 0.28 | 0.27 | 0.16 | 0.21 | 0.13 | 0.07 | 0.27 | 0.21 | 0.27 | 0.13 | 0.89 |
| [0.0] | 0.31 | 0.28 | 0.17 | 0.17 | 0.04 | 0.05 | 0.27 | 0.27 | 0.27 | 0.27 | 1.09 |
| Water sources | |||||||||||
| [1.0, 0.33] | 0.3 | 0.25 | 0.17 | 0.09 | 0.14 | 0.06 | 0.34 | 0.01 | 0.12 | 0.05 | 0.52 |
| [0.33, 0] | 0.29 | 0.27 | 0.17 | 0.16 | 0.12 | 0.05 | 0.23 | 0.12 | 0.23 | 0.16 | 0.74 |
| [0.0] | 0.33 | 0.35 | 0.17 | 0.09 | 0.09 | 0.05 | 0.23 | 0.23 | 0.23 | 0.23 | 0.92 |
| Mean5 | 0.29 | 0.29 | 0.17 | 0.13 | 0.1 | 0.06 | |||||
| SD6 | 0.04 | 0.04 | 0.01 | 0.04 | 0.03 | 0.01 | |||||
| Note: 1λ=The range of λ that produces equal solutions, where [and] show “equal to” and (and) show “higher than” and “lower than” boundary values, respectively 2FCR: Feed Conversion Ratio; TGC: Thermal Growth Coefficient; HW: Harvest Weight; U: Uniformity, LM: Late Maturity; D: Deformity 3D1, D2 and D3 are low, high, low and high for water temperature; D1, D2, D3, and D4 are <100 g, pan-sized and large fish, large fish and all sized for commercial products and river, spring, well and aqueduct water source; Underlined number shows maximum social group Disagreement (D) on the Con-P obtained 4Z=Overall disagreement (sum of D1 to D3 for water temperature; D1 to D4 for commercial products and water source) 5mean of Con-P values (all replicates) 6SD=Standard Deviation (all replicates) |
|||||||||||
Table 4. Estimation of consensus preferences (Con-P) and social group disagreements.
Desired genetic gains calculated using G% multiplied with the average of Con-P values in water temperature, commercial products, and water source categories are shown in Table 5. Desired genetic gains were 2.25, 1.43, 1.20, 1.04, 0.38, and 0.03% for FCR, LM, TGC, HW, D, and U, respectively
| Trait | G%1 | Con-P2 | Desired G%3 |
| Feed conversion ratio | 7.76% | 0.29 | 2.25 |
| Thermal growth coefficient | 4.15% | 0.29 | 1.2 |
| Harvest weight | 5.76% | 0.18 | 1.04 |
| Uniformity | 0.26% | 0.13 | 0.03 |
| Late maturity | 14.30% | 0.1 | 1.43 |
| Deformity | 6.40% | 0.06 | 0.38 |
| Note: 1G%=Percentage of genetic gain 2Con-P=Mean of consensus preference values from all replicates 3DesiredG%= Percentage of desired genetic gain |
|||
Table 5. Desired genetic gain of 6 traits obtained using extended WGP and social groups (water temperatures, commercial products and water source).
In this study, we employed a participatory approach to determine trait priorities among individual groups and consensus preferences among the categories to obtain desired genetic gains for the rainbow trout breeding objective.
Breeding traits and individual values
The six important economic traits selected from the 14 presented were FCR, TGC, HW, uniformity, LM, and deformity. Feed is one of the major costs of fish production, so reducing the FCR is very important to minimize cost and earn more profit in the farm. Moreover, TGC is important for obtaining optimum benefits on a farm. Harvest body weight is an important quantitative trait for rainbow trout in Iranian markets. Uniformity is often a desirable trait for trout producers worldwide, helping to produce homogenous and uniform products. Also, early maturation during the production period causes a reduction in growth and all the energy of the fish is spent on the development of the gonads, so the quality of the meat is reduced. Deformity also has a major impact on the market value of the fish.
Fillet weight (%), flesh redness, condition factor, body shape, skin color and spottiness, high water temperature tolerance and low water temperature tolerance were not chosen. These traits may be of less economic importance to farmers, or significant only to certain communities of farmers. Although, some of these traits overlap with the 6 selected traits. For example, fillet weight (%) and condition factor can be related to production traits. Also, in Iranian markets, the preference is to buy live fish, and buying fillets is rare and mostly in big cities. Flesh redness is economically important for large fish producers because they use color additives in the feed to produce a redder fillet and sell it more expensively and this trait is not important for small-size producers. In this study, some of the responders were small trout producers. This could be the reason for the low priority for redness. Body shape and color are influenced by environmental factors such as farm managemen, fish density and diet, light and background color conditions, water velocity, as well as harvest weight and age of maturity. In Iran, farmed rainbow trout have a high variation in body shape, skin color, and spottiness and mostly people prefer to slender fish with more silvery skin and fewer spots. High and low water temperature tolerance may negatively affect growth traits.
Disease resistance was one of the selected traits of most farmers. Unfortunately, due to the number of different diseases mentioned by the farmers in the first questionnaire (over 15 diseases; data not shown), because it was removed from the second questionnaire. Because it is practically impossible to choose all of them for breeding objectives.
Using the same methodology at the worldwide level to define rainbow trout breeding objectives, Sale-lim et al. selected feed conversion ratio, survival during the grow-out period, thermal growth coefficient, late maturity, condition factor and fillet percentage as the most important traits. In the study on the important traits of Nile tilapia (Oreochromis niloticus), growth and harvest weight traits were selected similar to the present study. Other traits included survival and thickness. Survival is one of the important economic traits in rainbow trout production. However, despite previous studies, considering that survival is dependent on many different causes such as water quality, disease, stress and management, although its heritability in a given year can be high, across years the heritability of survival is very low, as demonstrated by Vehvilhainen et al., it wasn't investigated in the present study.
Social values
The results in the Soc-P value showed that there were many changes in the priority of traits according to environmental and management differences. Production traits were the most important trait when rearing rainbow trout in different water temperatures. Late maturation is preferred by farmers with high water temperatures compared with other temperature farmers. Temperature is one of the important and effective environmental factors in the growth, metabolism, and reproduction of aquatic animals which could result in matured fish before they reach harvest size. In mature males it leads to aggressive behavior and in mature females it leads to early spawning and thus reduces the growth period. Finally, it has a negative effect on meat quality.
Preference values obtained by commercial products group showed that ≤ 100 g-sized producers preferred TGC followed by uniformity and deformity, respectively. Similar findings were observed that the farmers producing fry and fingerling preferred growth traits. This is important to arrive at optimal farm benefit. Uniformity is more important in ≤ 100 g-sized producers due to the reduction of cannibalism. As a result, it increases growth and feeding performance and reduces stress in fish. Deformation occurs especially in captivity because of artificial rearing, environmental stressors and management systems. Moreover, deformity is negatively correlated with body weight and leads to a reduced growth rate. Producers of "pan-sized and large fish", "large fish" and "all-sized fish" consider FCR more important than ≤ 100 g-sized producers. Similar findings were observed on large-sized trout. FCR is inconsequential in the early stage of growth because feed is one of the main costs of fish culture and is important at a later age.
TGC was preferred by river water source farmers. The temperature fluctuations of the river water are high throughout the year and depend on the environmental conditions. The economic impact of improving growth rate depends on temperature. Consequently, it is important for the development of breeding objectives maximizing economic return in fish breeding programs. Therefore, farmers rearing rainbow trout in river water prefer growth traits. On the other hand, the temperature was more stable in the other water sources. Hence, spring, well and aqueduct farmers chose FCR to reduce farm costs. At high-altitude farmers, FCR was considered more important than other traits. Feed is one of the major costs of trout production, considering that in Iran, most of the rainbow trout farms were located at this altitude, therefore, reducing the cost of the farm was more important for farmers than other traits.
Farmers who used a water reuse system indicated a stronger preference for TGC. A high density of fish, feeding rate, high CO2, low water exchange rate, as well as high microbial load in water reuse systems, decrease fish growth, health and survival. As a result, growth improvement was preferred by these farmers.
In this study, the greatest disagreement between the social group preference values was determined in the water temperature, commercial production, and water source categories and the lowest disagreement was observed in the water circulation and altitude categories. It shows that reaching an agreement is more important for producers who have different water temperatures, product goals or water sources. So the values of Con-p were calculated for the consensus of these categories.
Consensus values
Grouping of farmers values showed that water temperature, commercial production and water source categories had the highest level of disagreements in social group preference values among rainbow trout farmers. We have used extended WGP according to Sae-Lim et al., method to achieve Con-P values of traits by minimizing the disagreement between groups. One of the advantages of using extended WGP is the possibility of studying and investigating changes in trait preferences due to different social groups and calculating consensus preference values despite the existence of disagreements among social groups. The models used in this study are a suitable option for breeders who calculate the breeding goals and the desired genetic gains. This result leads to a desired genetic gain benefit.
The average Con-P values of the investigated groups can be considered as a convergence between Con-P values for all three categories and allocating all the different environmental and management conditions.
Desired genetic gains
The highest rate of desired genetic gains in this study was for the FCR (2.23%). In their previous study on rainbow trout, Sae-Lim et al. also showed that the FCR (1.87%) had the highest rate of desired genetic gains. In rainbow trout farming like other farmed fish, the cost of feed is between 30%-70% of the total cost of production. For many fish farmers, improving FCR is significant to decrease expenses and increase farm benefits, especially during grow-out time. So genetic improvement of FCR is important in improving the economics of the aquaculture industry. In the present study, the lowest rate of desired genetic gains was for uniformity (0.03%). Because uniformity is more important for small-size producers due to the reduction of cannibalism. In the previous studies, the lowest rate was for fillet% (0.06%) in rainbow trout. Because the fillet is more important to the processors and the less filleting of this fish compared to other salmon, including Atlantic salmon.
Genetic parameter estimates for the 6 important traits included here are available in the rainbow trout literature. When the trait means and phenotypic and genotypic (co)variances are known, the desired genetic gains obtained in this study can be used to determine selection indexes and weighting factors of breeding objective traits. These desired gains can be the basis for designing an optimal multi-trait breeding program.
Identifying the priority traits is essential for the design of sustainable breeding programs in aquaculture. In this study, the ranking of traits that were considered in trout farming in Iran showed that feed conversion ratio, thermal growth coefficient, harvest weight, uniformity, late maturity, and deformity were relatively more considered by farmers. The priority of selecting these traits was determined and optimized using the combination of three methods: AHP, WGP, and extended WGP, despite the difference in environmental conditions and the management of farmers. These results highlight that it can be used in the breeding program of the rainbow trout as an economic species for the development of aquaculture industries.
Mina Rahbar: Writing–original draft, conceptualization, methodology, validation, formal analysis, software, interviews, investigation, data curation, project administration, visualization, supervision. Roghieh Safari: Writing–review and editing, methodology, validation, interviews, visualization, supervision. All authors read and approved the final manuscript.
The authors have no relevant financial or non-financial interests to disclose.
The data can be obtained from the corresponding author upon request.
We thank the private trout farmers in Iran who were involved in the survey and the support of Gorgan University of Agricultural Sciences and Natural Resources.
This research was done with the financial support of Gorgan University of Agricultural Sciences and Natural Resources with No. 02-489-49.
[Crossref] [Google Scholar] [PubMed]
[Crossref] [Google Scholar] [PubMed]