Research & Reviews: Journal of Ecology and Environmental Sciences
ISSN: 2347-7830
ISSN: 2347-7830
Andrew Ichoja1*, O. O. Agboola2, E. E Onwoke1, E.D.Onoja1, N. Habila3 and E. O. Adejo1
1 Department of Medical Physics, Federal University of Health Sciences, Otukpo, Nigeria
2 Department of Biological Sciences, Federal University of Health Sciences, Otukpo, Nigeria
3 Department of Science, Plateau State Polytechnic, Bukuru, Nigeria
Received: 01-Dec-2023, Manuscript No. JEAES-23-121912; Editor assigned: 04-Dec-2023, Pre QC No. JEAES-23-121912(PQ); Reviewed: 18-Dec-2024, QC No. JEAES-23-121912; Revised: 26-Dec-2024, Manuscript No. JEAES-23-121912 (R); Published: 02-Jan-2024, DOI: 10.4172/2347-7830.11.4.08
Citation: Ichoja A, et al. Radon Level Approximation and the Corresponding Health Effects: The Southern Benue Groundwater Sources Analysis RRJ Ecol Environ Sci. 2024;11:008
Copyright: © 2024, Ichoja A, et al. This is an open-access article distributed under the terms of the Creative Commons Attribution License, which permits unrestricted use, distribution, and reproduction in any medium, provided the original author and source are credited.
Visit for more related articles at Research & Reviews: Journal of Ecology and Environmental Sciences
In this research, activity concentration of Rn-222 was estimated in groundwater samples collected from different parts of Benue State, Nigeria. The twenty-six (26) water samples from well and stream sources were analysed using standardized Liquid Scintillation Counter (LSC) for the determination of radon activity concentration and their corresponding health effects on the general population. The results showed highest radon values of 13.56 ± 0.88 Bq/l and 18.24 ± 1.42 Bq/l for well water samples higher than USEPA recommended values of 11.1 Bq/l for Apa and Agatu LGAs respectively, while 6.659 ± 0.36 Bq/l lower than the acceptable limit was recorded for the surface water samples. The annual committed effective dose from intake of Rn-222 radionuclide to different human ICRP age groups were remarkably below the acceptable 1.0 mSv/y baseline but with a significant and consistent rise with the age and water consumption rate. The calculated ELCR and LCC from ACED due to ingestion were found to be remarkably lower than the standard reference point of 0.29 mSv/y. The evaluated dose to different organs such as lungs, testes, ovaries, bone marrow, kidney, liver and whole body vary significantly with the mean values in the range of 0.009–0.017, 0.012 – 0.021 and 0.006 –0.011 for well and surface water sources respectively. The maximum average dose values were recorded in the testes and this may be attributed to the organ location and adopted approximation factor. The obtained results therefore suggest that the evaluated radon parameters and dose to sensitive organs have no immediate consequence on public health but routine research activity on groundwater sources in the study location is strongly recommended to avert any possible health risks.
Activity concentration; Ingestion; Excess life cancer risks; Annual committed effective dose; Organ dose
Globally, there is rising concern about the high-level presence of radioactivity in drinking water sources, especially in underdeveloped and developing countries like Nigeria, where the agencies concerned pay little attention to the quality of drinking water. The three known generic natural radioactive materials are Uranium, Thorium and Radium. The deadly Radon (Rn-222) is a product of alpha emission of radium (Ra-226). It belongs to the decay series of Uranium (U-238), Thorium (TH-234), which are naturally found in rocks or soil [1]. The presence of Rn-222 in drinking water is enhanced by the continuous diffusion of water through rocks leading to high Rn-222 deposits in drinking water sources (wells, borehole and streams). Radon poses a significant concern to public health because of its high half-life of approximately 3.82 days. Again, since radon has neither color, odour nor taste, it is considered as the most important, dangerous, toxic and hazardous of all radon isotopes (219Rn with T1/2 =3.96 s, 220Rn with T1/2 =56.6 s and 222Rn with T1/2 =3.83 [2]. It is chemically an inert gas and does not react with other elements and has great potency to stay reasonably long in the atmosphere [3,4]. Ingestion of radon (Rn-222) via drinking of dissolved radon in water or inhalation of released radon gas in the atmosphere are the two pathways for increased human internal exposure rate to radon. The emitted beta and gamma ionizing radiation and their short-lived decay products (Po-214 with T1/2 =164 μs and Po-218 with T1/2 =3.05 mins) emanating from the radon intake can easily adapt and deposit its energy to the cells of the respiratory system and causes damages to the Deoxyribonucleic Acid (DNA), removal and rearrangement of chromosome mutation [4-6] . Hence, stomach and lung cancers may be linked primarily to ingestion and inhalation of Rn-222.
The hazardous nature of R-222 coupled with the relatively long half-life of radon has made it a serious potential public health risks. It has been categorized as carcinogenic and the main cause of lung cancer among non-smokers and the second leading cause of death for tobacco smokers [8-10]. Approximately 85% of global radiation dose received by humans is attributed to natural radioactive sources and about 50% of it is due to ingestion and inhalation of radon gas [11]. Radon concentrations in groundwater sources such as wells and boreholes are normally higher compared to those of surface water due to the rapid outgassing of radon into the atmosphere [12,13]. Underground (wells) and surface water sources remain the two major available sources of drinking water in the study locations. Well water has high potential of radon contents due to uranium series of radionuclide in the earth’s crust. The United States Environmental Protection Agency (USEPA) has proposed 11.1 Bq/l as the Maximum Contamination Level (MCL) of radon in public drinking water sources which is premised on inhalation risks from distribution of Rn-222 waterborne. This study, therefore, was conducted in the dry season between January and March, when the inhabitants rely heavily on groundwater sources (wells and stream) for survival due to acute water shortages in these periods. Hence, this pioneering work is aimed at determining the radon (Rn-222) concentration level in drinking water sources and estimating the possible damaging health effects including Annual Committed Effective Dose (ACED) for different age groups, Lung Cancer Cases (LCC) and Excess Lifetime Cancer Risks (ELCR) due to consumption of such water sources.
Description of study area
Benue State is situated between Latitudes 6°30'N and 8°15'N and Longitudes 7°30'E and 10°00'E with a land area of about 34,059 km2 and a population of 2,780,398 by 1991 Census and 4,253,541 by 2006 estimate. The study area covers 12 out of the 23 Local Government Areas (LGAs) of Benue State, namely: Ado, Obi, Oju, Konshisha, Gboko, Ushongo, Vandeikya, Tarka, Buruku, Logo, Katsina-Ala and Ukum. Benue State experiences two distinct seasons, the wet season and the dry season. The rainy season lasts from April to October with annual rainfall in the range of 1120 to 1500 mm. The dry season begins in November and ends in March. The climate is characterized by a high-temperature regime, ranging from 27-38°C as the mean annual. The relative humidity is between 60 and 80%. It has a vegetation cover of the guinea savannah type. The main river systems include the River Benue and the River Katsina-Ala which together with their tributaries, traverse the area. The drainage system of the Cross River basin bordering the lower Benue basin to the south rises from the area, through the River Konshisha and its tributary rivulets and streams, flowing southwards into the main basin of the Cross River to the south. The region is well-drained and presents good potential for water resource development. The stream flow over the impermeable geological environments indicates low groundwater components and very high runoff.
The materials used in this research include: Liquid scintillation analyser– (Packard Tri-Card–LSA-1000TR), Scintillation vial–20ml with cap, distilled water, Plastic sample collection bottles (200ml and 100ml capacity, Disposable hypodermic syringe (10ml and 20ml capacity) with 38mm hypodermic needle, Surgical hand gloves, Adjustable scintillation cocktail dispenser (8) Radium solution, Insta-gel, Indelible mark and abro masking tape, Global Positioning System (GPS), Biro and paper.
Sample collection and preparation for Rn-222 analysis
A total of twenty-six (26) water samples were collected in all for the examination. Twenty (20) samples of 100 ml of well water and six (6) samples of 100 ml of surface water were collected in a plastic container from the various study sites in Apa and Agatu LGAs of Benue State. All the samples were collected under a turbulent-free condition to minimize radon losses and attain equilibrium of the radionuclide. The screw cap containers of the water samples were tightly sealed to ensure airtightness and allowed to equilibrate in readiness for the analysis. All 26 water samples collected were first prepared by adding a mixture of 10 ml of each of the water samples and an Insta-gel Scintillation cocktail to the scintillation vial. The vial was sealed tightly and shaken thoroughly for some minutes to extra radon (222Rn) in the water phase into the organic scintillator. The prepared water samples were analyzed using the Tri-Carb 3110 Liquid Scintillation Counter from Perkin Elmer company, located at the Centre for Energy Research and Training (CERT), Ahmadu Bello University Zaria, Kaduna State, Nigeria. Efficiency calibration of the counting system for the activity concentration was carried out using the IAEA 226Ra standard solution before the actual analysis.
To determine the activity concentration of radon, the decay correction factor equation represented in equation 1 was used to correct the time elapsed between sample collection and analysis [14,15].
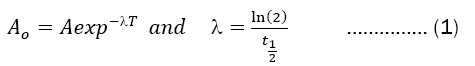
Where An is the original activity of the samples; A is the activity at the sample analysis time and T is the decay time in days. Annual Committed Effective Dose (ACED) to different ICRP age grades as well as ACED for ingestion and inhalation of radon by the inhabitants were calculated from the estimated values of radon concentration in water (Ao) using Equations (2), (3) and (4) respectively [16,17].


The Excess Lifetime Cancer Risks (ELCR) and lung cancer cases were determined using equations 5 and 6 respectively [18,19].


Where DL is the typical life expectancy duration of 70 years and RF is the stochastic cancer risk factor per Sievert (5×10⁻²) and 18×10−6 is the risk factor for lung cancer induction.
Estimation of Rn-222 concentration in drinking water
The Rn-222 activity concentration in drinking water samples collected from the different sites in Apa and Agatu LGAs are as shown in Figures 1-3. The results as displayed in Tables 1&−3 showed the various magnitudes of activity concentration of Rn-222 in well and surface water.
| Sample ID | Rn-Bq/L | ACED (mSv/y) | Lungs | Ovaries | Bone Marrow | Testes | Kidney | Liver | Whole Body | ELCR (Sv/y) | LCC (mSv/y) |
|---|---|---|---|---|---|---|---|---|---|---|---|
| (mSv/y) | (mSv/y) | (mSv/y) | (mSv/y) | (mSv/y) | (mSv/y) | (mSv/y) | |||||
| APW1 | 8.071 | 0.020 | 0.013 | 0.012 | 0.014 | 0.017 | 0.013 | 0.009 | 0.014 | 0.071 | 3.662 |
| APW2 | 8.836 | 0.022 | 0.014 | 0.013 | 0.015 | 0.018 | 0.014 | 0.010 | 0.015 | 0.078 | 4.008 |
| APW3 | 7.190 | 0.018 | 0.012 | 0.011 | 0.013 | 0.015 | 0.011 | 0.008 | 0.012 | 0.063 | 3.262 |
| APW4 | 6.303 | 0.016 | 0.010 | 0.009 | 0.011 | 0.013 | 0.010 | 0.007 | 0.011 | 0.056 | 2.859 |
| APW5 | 4.992 | 0.013 | 0.008 | 0.007 | 0.009 | 0.010 | 0.008 | 0.006 | 0.009 | 0.044 | 2.265 |
| APW6 | 13.562 | 0.034 | 0.022 | 0.020 | 0.024 | 0.028 | 0.021 | 0.016 | 0.023 | 0.120 | 6.151 |
| APW7 | 12.797 | 0.032 | 0.021 | 0.019 | 0.022 | 0.026 | 0.020 | 0.015 | 0.022 | 0.113 | 5.805 |
| APW8 | 3.827 | 0.010 | 0.006 | 0.006 | 0.007 | 0.008 | 0.006 | 0.004 | 0.007 | 0.034 | 1.735 |
| APW9 | 11.349 | 0.029 | 0.018 | 0.017 | 0.020 | 0.023 | 0.018 | 0.013 | 0.019 | 0.100 | 5.147 |
| APW10 | 4.898 | 0.012 | 0.008 | 0.007 | 0.009 | 0.010 | 0.008 | 0.006 | 0.008 | 0.043 | 2.221 |
| MIN | 3.827 | 0.010 | 0.006 | 0.006 | 0.007 | 0.008 | 0.006 | 0.004 | 0.007 | 0.034 | 1.736 |
| MAX | 13.562 | 0.034 | 0.022 | 0.020 | 0.024 | 0.028 | 0.021 | 0.016 | 0.023 | 0.12 | 6.152 |
| AVER | 8.182 | 0.021 | 0.013 | 0.012 | 0.014 | 0.017 | 0.013 | 0.009 | 0.014 | 0.072 | 3.712 |
| STDEV | 3.418 | 0.009 | 0.006 | 0.005 | 0.006 | 0.007 | 0.005 | 0.004 | 0.006 | 0.030 | 1.550 |
| STDRR | 0.88 | 0.002 | 0.001 | 0.001 | 0.002 | 0.002 | 0.001 | 0.001 | 0.002 | 0.008 | 4.003 |
Table 1. Activity concentration, ACED, ELCR, LCC and dose to different organs in Apa LGA well water sources.
| Sample ID | Rn-Bq/L | ACED (mSv/y) | Lungs | Ovaries | Bone Marrow | Testes | Kidney | Liver | Whole Body | ELCR (Sv/y) | LCC (mSv/y) |
|---|---|---|---|---|---|---|---|---|---|---|---|
| (mSv/y) | (mSv/y) | (mSv/y) | (mSv/y) | (mSv/y) | (mSv/y) | (mSv/y) | |||||
| AGW1 | 16.540 | 0.042 | 0.027 | 0.024 | 0.029 | 0.034 | 0.026 | 0.019 | 0.028 | 0.146 | 7.502 |
| AGW2 | 18.088 | 0.046 | 0.029 | 0.026 | 0.031 | 0.037 | 0.028 | 0.021 | 0.031 | 0.160 | 8.205 |
| AGW3 | 18.243 | 0.046 | 0.029 | 0.027 | 0.032 | 0.038 | 0.029 | 0.021 | 0.031 | 0.161 | 8.275 |
| AGW4 | 9.074 | 0.023 | 0.015 | 0.013 | 0.016 | 0.019 | 0.014 | 0.011 | 0.016 | 0.080 | 4.116 |
| AGW5 | 8.626 | 0.022 | 0.014 | 0.013 | 0.015 | 0.018 | 0.013 | 0.01 | 0.015 | 0.076 | 3.912 |
| AGW6 | 10.620 | 0.027 | 0.017 | 0.016 | 0.018 | 0.022 | 0.017 | 0.012 | 0.018 | 0.094 | 4.817 |
| AGW7 | 4.036 | 0.010 | 0.007 | 0.006 | 0.007 | 0.008 | 0.006 | 0.005 | 0.007 | 0.036 | 1.830 |
| AGW8 | 4.845 | 0.012 | 0.008 | 0.007 | 0.008 | 0.010 | 0.008 | 0.006 | 0.008 | 0.043 | 2.198 |
| AGW9 | 5.145 | 0.013 | 0.008 | 0.008 | 0.009 | 0.011 | 0.008 | 0.006 | 0.009 | 0.045 | 2.334 |
| AGW10 | 7.151 | 0.018 | 0.012 | 0.010 | 0.012 | 0.015 | 0.011 | 0.008 | 0.012 | 0.063 | 3.243 |
| MIN | 4.036 | 0.010 | 0.007 | 0.006 | 0.007 | 0.008 | 0.006 | 0.005 | 0.007 | 0.036 | 1.831 |
| MAX | 18.243 | 0.046 | 0.029 | 0.027 | 0.032 | 0.038 | 0.029 | 0.021 | 0.031 | 0.161 | 8.275 |
| AVER | 10.237 | 0.026 | 0.017 | 0.015 | 0.018 | 0.021 | 0.016 | 0.012 | 0.018 | 0.090 | 4.643 |
| STDEV | 5.503 | 0.014 | 0.009 | 0.008 | 0.01 | 0.011 | 0.009 | 0.006 | 0.009 | 0.049 | 2.496 |
| STDRR | 1.42 | 0.004 | 0.002 | 0.002 | 0.002 | 0.003 | 0.002 | 0.002 | 0.002 | 0.013 | 6.445 |
Table 2. Activity concentration, ACED, ELCR, LCC and dose to different organs in Agatu LGA well water sources.
| Sample ID | Rn-Bq/L | ACED (mSv/y) | Lungs | Ovaries | Bone Marrow | Testes | Kidney | Liver | Whole Body | ELCR (Sv/y) | LCC (mSv/y) |
|---|---|---|---|---|---|---|---|---|---|---|---|
| (mSv/y) | (mSv/y) | (mSv/y) | (mSv/y) | (mSv/y) | (mSv/y) | (mSv/y) | |||||
| APS1 | 5.985 | 0.015 | 0.010 | 0.009 | 0.010 | 0.012 | 0.009 | 0.007 | 0.010 | 0.053 | 2.715 |
| APS2 | 6.659 | 0.017 | 0.011 | 0.010 | 0.012 | 0.014 | 0.010 | 0.008 | 0.011 | 0.059 | 3.020 |
| APS3 | 5.191 | 0.013 | 0.008 | 0.008 | 0.009 | 0.011 | 0.008 | 0.006 | 0.009 | 0.046 | 2.355 |
| APS4 | 5.905 | 0.015 | 0.010 | 0.009 | 0.010 | 0.012 | 0.009 | 0.007 | 0.010 | 0.052 | 2.678 |
| AGS5 | 5.330 | 0.013 | 0.009 | 0.008 | 0.009 | 0.011 | 0.008 | 0.006 | 0.009 | 0.047 | 2.418 |
| AGS6 | 2.617 | 0.007 | 0.004 | 0.004 | 0.005 | 0.005 | 0.004 | 0.003 | 0.004 | 0.023 | 1.187 |
| MIN | 2.617 | 0.007 | 0.004 | 0.004 | 0.005 | 0.005 | 0.004 | 0.003 | 0.004 | 0.023 | 1.187 |
| MAX | 6.659 | 0.017 | 0.011 | 0.010 | 0.012 | 0.014 | 0.010 | 0.008 | 0.011 | 0.059 | 3.020 |
| AVER | 5.281 | 0.013 | 0.009 | 0.008 | 0.009 | 0.011 | 0.008 | 0.006 | 0.009 | 0.047 | 2.396 |
| STDEV | 1.406 | 0.004 | 0.002 | 0.002 | 0.002 | 0.003 | 0.002 | 0.002 | 0.002 | 0.012 | 6.379 |
| STDRR | 0.36 | 0.001 | 0.001 | 0.001 | 0.001 | 0.001 | 0.001 | 0.000 | 0.001 | 0.003 | 1.647 |
Table 3. Activity concentration, ACED, ELCR, LCC and gose to different organs in Apa and Agatu LGA surface water sources.

Figure 1: Distribution of radon concentration in Apa well water samples. 

Figure 2: Distribution of radon concentration in Agatu well water samples.. 

Figure 3: Distribution of radon concentration in Apa and Agatu surface water samples.  sources in Apa and Agatu LGAs.
For well water samples, the activity concentration of radon ranged from 3.827–13.562 ± 0.88 Bq/l (Apa) and 4.036–6.659 ± 1.42 Bq/l (Agatu), whereas Rn-222 activity concentration for surface water samples were found in the 2.617–6.659 ± 0.36 Bq/l. The water sample point with identity APW6 (Ugbokpo I) yielded the highest radon content (18.24 ± 1.74Bq/l) , whereas the minimum value of radon concentration which is 2.18 ± 0.47 Bq/l) was recorded at the AGS6 sampling location (Obagaji). The results showed that the activity concentration of radon in well water was higher than those from surface water samples. The observed variations of radon concentration in the studied water samples could be attributed to different factors such as the depth of the aquifers, Uranium deposit, climatic conditions as well as mobility and solubility of the radionuclides [20,21] . Comparing the present result with USEPA (Figure 4), indicates 30% of Rn-222 concentration in AGWS (Agatu water sample) and 20% of APWS (Apa water sample) sampling stations were found to be more than the USEPA guideline of 11.1 Bq/l, but all the AGSS sample were well below the maximum limit. The current results on activities of Rn-222 in drinking water were remarkably lower in comparison with other findings on Rn-222 across the world by other researchers who measured the activity concentration of Rn-222 in drinking water [13,22-25].

Figure 4: Comparison of Rn-222 concentration with USEPA.
Assessment of Annual Committed Effective Dose (ACED)
In the present study, the annual committed effective dose was estimated from the measured activity of Rn-222 in drinking water. The ACED in well water samples from intake of radionuclide due to ingestion and inhalation of Rn-222 radioactivity ranged from 27.52 to 133.17 ± 7.47 μSv−1 and 9.50 to 45.97 ± 7.47 μSv−1 respectively. The estimated mean dose of Rn-222 from the sample water intake for ingestion was found to be 66.79 ± 7.47 μSv−1 while the corresponding average dose from the intake of Rn-222 in well water sources via inhalation was recorded at 23.05 ± 2.58 μSv−1. Meanwhile, the annual committed effective dose for ingestion and inhalation of radon from the surface water source were found in the region of 15.93 − 40.52 ± 3.49 μSv−1 with an average value of 32.14 ± 3.49 μSv−1 and 5.50−13.99 ± 1.21 μSv−1 with the mean value of 11.09 ± 1.20 μSv−1 respectively. The ACED for both well and surface water samples was found to be lower than 0.29 mSv/y maximum permissible concentration proposed by the World Health Organization. The calculated values of the annual committed effective dose for the different age groups are as shown in Figure 5. The ACED values for both the well and surface sampling points in this study were found to be lower than the value of 0.1 mSv/y threshold for Rn-222 concentration in water proposed by the World Health Organization for consumption. Therefore the water sampling sources in these communities might be considered safe for domestic applications (WHO, 2011). Additionally, the aged-dependent ACED values for the various water samples indicated a consistent rise with age (Adults>Children>Infants) and the volume of water consumed by individuals irrespective of the sensitivity of the children internal organs.

Figure 5: Comparison of annual effective dose for different age groups with WHO.

Analysis of dose to different sensitive organs
Figures 6-8 represent the ingestion dose to various sensitive organs for Apa and Agatu well water samples and their corresponding surface water samples respectively. For Apa well water samples the organ doses were ranged from 0.006−0.0022 mSv/y (Lungs), 0.006−0.020 mSv/y (Ovaries), 0.007−0.024 mSv/y (Bone marrow), 0.008−0.028 mSv/y (Testes), 0.006−0.021 mSv/y (Kidney), 0.004−0.016 mSv/y and 0.007−0.0023 mSv/y.

Figure 6: Organ dose from well water samples for Apa LGAs.


Figure 7: Organ dose from well water samples for Agatu LGAs.


Figure 8: Organ dose from Apa and Agatu surface water samples.

Organ dose from well water samples for Apa LGAs
Meanwhile, organ dose for Agatu well water samples as displayed in Figure 7 were found in the range 0.007−0.0029 mSv/y (Lungs), 0.006−0.027 mSv/y (Ovaries), 0.007−0.032 mSv/y (Bone marrow), 0.008 − 0.088 mSv/y (Testes), 0.006 − 0.029 mSv/y (Kidney), 0.005 −0.021 mSv/y and 0.007−0.0031 mSv/y.
Organ Dose from well water samples for Agatu LGAs
Whereas, the dose to organs from surface water samples as represented in Figure 8, were varied from 0.004 − 0.0011mSv/y (Lungs), 0.004−0.010 mSv/y (Ovaries), 0.005−0.012 mSv/y (Bone marrow), 0.005−0.014 mSv/y (Testes), 0.004−0.010 mSv/y (Kidney), 0.003−0.008 mSv/y and 0.004−0.0011 mSv/y.
From the analysis, it can be observed that organ number 6 (Testes) in all cases has the maximum values of 0.028 mSv/y, 0.038 mSv/y and 0.014 mSv/y in well water samples from Apa and Aatuu, and the surface water samples respectively. The sampling points with identities APW6, AGW3 and APS2 sample locations have the maximum values, whereas the minimum dose values were found in the liver in all the study locations. The high values found in the testes may be linked to the high organ conversion factor and the geological structure of the study sites.
Estimation of Excess Life Cancer Risks (ELCR) and Lung Cancer Cases (LCC)
Epidemiological studies have shown that the manifestation of lung cancer due to radioactive nuclide exposure is usually not immediate but at an advanced age and the latent period varies among individuals [26]. Excess life cancer risks are the probability of an individual developing cancer in his lifetime of radiation exposure [27]. In this study, the respective average values of ELCR for ingestion and inhalation of Rn-222 in the water samples were calculated. The evaluated values were generally found below the global standard value of 0.29 mSv/y prescribed by radiological protection agencies [28,29]. The obtained result is suggestive of a low possibility of an adult above 70 years developing cancer over a lifetime from the consumption of the sampled water from the community. The calculated values of LCC for ingestion and inhalation for Apa LGA water samples have an average value of 10.6200 and 3.6576 per million persons per year respectively, 13.4460 and 4.6435 per million persons per year respectively for Agatu LGA. The LCC values for ingestion and inhalation of air from the surface water samples for the two areas were found in the region of 77 and 99 with an average value of 98 per million persons per year. The calculated LCCs in the present work were found to be lower than the 170-230 maximum limit recommended by ICRP.
The value of activity concentration of radon (Rn-222) from well water sources was higher than those from surface sources. Rn-222 values for well water in some sampling locations were more than the USEPA recommended level of 11.1 Bq/l and less than the range of 4-40 Bq/l proposed by the UNSCEAR. Although, the calculated values of the annual committed effective dose for ingestion were found to be higher than that of inhalation, however, the obtained values in both cases were far below the recommended threshold value of 0.1mSv/y by WHO. Additionally, the lower values ELCR and LCC below the recommended standard limit of 0.29 mSv/y and rang (170−230 per million persons per year) suggested a low probability of an adult approaching 70 years developing cancer over their lifetime from the consumption of water sources. Hence, the present research does not reveal any immediate health effects arising from the ingestion and inhalation of radon in drinking water sources in the study areas.
The authors are grateful to the Management of the Federal University of Health Sciences Otukpo, Benue State, Nigeria, and the Government of Federal Republic of Nigeria through the Tertiary Education Trust fund (TETFUND) for their financial support in form of 2022/FX302 Institutional Based Research (IBR) grant.