Abdu R Rahman1*, Zahid Asghar2, Salman A Cheem3, Tahir Munir4
1Department of Global Health and Development, The Aga Khan University, Karachi, Pakistan
2Department of Economics, Quaid-i-Azam University Islamabad, Islamabad, Pakistan
3Department of Applied Sciences, National Textile University, Faisalabad, Pakistan
4Department of Anaesthesiology, The Aga Khan University, Karachi, Pakistan
Received: 07-Jan-2023, Manuscript No. JSMS-23-86138; Editor assigned: 09-Jan-2023, Pre QC No. JSMS-23-86138 (PQ); Reviewed: 23-Jan-2023, QC No. JSMS-23-86138; Revised: 18-Apr-2023, Manuscript No. JSMS-23-86138 (R); Published: 01-Jun-2023, DOI:10.4172/JSMS.9.2.011
Citation: Rahman AR, et al. Socio-Economic Risk Profiling of Child Nutritional Status: Evidence from the Most Populous Province of Pakistan. RRJ Stats Math Sci. 2023;09:011.
Copyright: © 2023 Rahman AR, et al. This is an open-access article distributed under the terms of the Creative Commons Attribution License, which permits unrestricted use, distribution and reproduction in any medium, provided the original author and source are credited.
Visit for more related articles at Research & Reviews: Journal of Statistics and Mathematical Sciences
Child malnutrition is considered one of the most focused areas of development, globally. The situation in developing countries, with lower literacy rate and lesser health awareness, is even more alarming and unpleasant. Pakistan a country of 220 million populations with literacy rate of 65 percent remains a prime candidate, worth studying the diverse nature of the issue. This research focuses on the analysis of Punjab based data the most populated province of Pakistan, sharing 50 percent of the total population of the country. Principally, this research advances the existing literature mainly on two fronts. Firstly, we study children nourishment status through ordinal scale and thus identify the more vulnerable and priority groups existent in the population. Secondly, we propose the use of WHO Infant and Young Children Feeding guidelines (IYCF) for food quality, as a determinant of child nourishment status. Also, we consider weight for age, as a composite anthropometric indicator to quantify the nourishment status of children of age under five years. Based on this indicator, child nourishment status is then categorized into three distinctive and hierarchical groups: severely malnourished (<-3.0 Z-score), moderately malnourished (-3.0 to -2.01 Z-score) and not malnourished (≥ 2.0 Z score). The objectives are achieved by using the Multiple Indicator Cluster Survey (MICS) 2017-2018 data for the Punjab province comprehending a sample of 25211 children. We observe that 7% children can be ranked as severely malnourished whereas, 14.5% children stayed in the moderately malnourished category. Moreover, bivariate analysis reveals statistically significant association between children nourishment status and, food intake diversity, mother education and health awareness, child previous health history and economic status of the household. The explanatory power of the determinants of malnourishment is assessed by employing various modeling strategies capable of entertaining diverse ordinal structures. We use Proportional Odds Model (POM), Non-Proportional Odds Model (NPOM). Based on keen application of statistical modeling techniques, our study suggests that NPOM can be considered as a more sophisticated approach to explore the factors affecting the child malnutrition. The findings of this research imply that, government and development organizations need to focus, not only, on improvement of overall household well-being but also required advocating the urgency for balanced food.
Child nourishment status; Food diversity; Generalized linear model; Multiple indicator cluster survey; Ordinal data
Nourishment status of individuals remains one of the elementary indicators delineating the extent of overall social and physical human welfare. The study of child nourishment status and its inter linkage with socio-economic growth has remained a core topic of various studies from diverse research areas. For example, Carlson suggested the overall nourishment status as a determinant of social capital. Hoddinott, et al., highlighted economic aspects of better nourishment by identifying lower health care expenditures as a natural outcome [1]. Similarly, Victora, et al., studied long term effects of malnutrition in children and listed, impaired cognitive development, lower attained schooling and increased risk of chronic diseases, as irreversible consequences of poor nutrition. Moreover, the targets 2.1 and 2.2 of Sustainable Development Goals (SDGs) focus to end hunger and reduce malnutrition to get rapid economic growth. For more recent accounts in this regard, see also Gul and Kibria; Talukder; Paul, et al. Despite being globally focused area of improvement, according to UNICEF report about 2.6 million people die each year due to malnutrition, see also Black, et al. Additionally, the number of malnourished people increased from 785.8 million in 2014 to 821.6 million in 2018, worldwide. The situation among more vulnerable and fragile group, that is, the children under five years age, is even more upsetting. According to the world health organization report, 155 million children under five years of age were stunted (too short with respect to age). Whereas 52 million children were considered as wasted (too thin with respect to height) and 462 million were assessed as underweight (small weight with respect to age). The South Asian region is doomed to be the major contributor in the odds of malnourished children in the world. This region alone contributes to 40% (59.4 million) of world's stunted children and 53% (27 million) of world's wasted children (UNICEF, 2018). Within this region, the standing of Pakistan is even more unpleasant Pakistan was observed as highest shareholder in stunting with 45% in 2012-2013. Although, the percentage of malnourished children has declined over the past 15 years, but still 40.2%, 17.7% and 28.9% of young children are stunted, wasted and underweight, respectively, see also, Mushtaq, et al; Batool, et al; Gul and Kibria.
Motivated by the relevant nature of the issue, this study focuses on exploring the potential factors determining the child nourishment status in Punjab province of Pakistan. The objectives are achieved by a detailed analysis of Multiple Indicator Cluster Survey (MICS) 2017-2018 data for Punjab. The significance of the analysis of Punjab based data remains intact as the province shares half of the total population of the country. Thus, a small percentage of malnourished children add a large absolute number to the total of malnourished population. The goals of this research are two fold. Firstly, to devise more sophisticated strategies capable of entertaining the underlying ordinal structure, prevalent in the nourishment status. Secondly, based on the findings, facilitate the meaningful and better informed policies to achieve targets 2.1 and 2.2 of the SDGs. In per suite of the afore mentioned goals, along with detailed exploratory analysis, we employ variety of Generalized Linear Models (GLMs), while stratifying nourishment status into three hierarchical categories. Furthermore, along with routinely used literature driven factors, we propose the use of food diversity index, to enhance the understanding of the issue [2].
This article is divided into four major sections. In next section, we provide a comprehensive account of data, covariates, their measurements, and modelling schemes employed in this research. Section 3 offers a detail discussion about the findings of the study with respect to various modeling themes subject to specific assumptions. Lastly, section 4 provides brief overview of the matter focusing on policy implications [3].
Data and design
The data for current study are extracted from 6th round of MICS Punjab a data collection exercise jointly conducted by Punjab Bureau of Statistics and UNICEF. The aim of MICS is to assemble information on socioeconomic indicators at individual level as well as household level and health awareness among women. Thus, MICS serves as primary tool in district level policy formulation in Punjab. The authenticity of the information collected through MICS is well celebrated among organizational and academic research circles. For MICS (2017-2018), two stage stratified sampling design was adopted. At first stage, each district of the province was stratified into rural and urban enumeration blocks. The weights to the enumeration blocks were assigned through probability proportional to size sampling scheme. In second stage, from each selected enumeration block, 20 households were finally approached as member of selected sample through systematic sampling scheme. Thus, as a result of MICS (2017-2018) 53,840 households were approached from 2692 enumeration blocks. Among the selected households, 51660 households were successfully interviewed with a response rate of 97.9 percent. At individual level, MICS (2017-2018) comprehends the information about 74010 women, 27094 men and 42408 children under the age of five years [4].
Response variable
The child’s nourishment status is usually estimated by using three contemporary anthropometric indicators, such as height for age, weight for height, and weight for age. Among three, the weight for age is commonly considered as the most attractive representative of nourishment status, see for example, national institute of population research. The most convincing feature of the indicator remains it ability to cater weight for height and height for age indices, jointly, and therefore, successfully measures both chronic and acute malnutrition [5]. In this research we use weight-for-age indicator to assess child’s overall nourishment status. Following the WHO guidelines, the indicator is measured as Z-score ranging from -6 to +6. After calculating Z-scores, we stratified nourishment status into three ordered categories, such as, (1)-not malnourished (≥ -2 Z-score), (2)-moderately malnourished (-3.0 to -2.01 Z-score) and (3)-Severely malnourished (<-3 Z-score). The analysis of the nourishment status is persuaded with respect to hierarchical categories [6].
Explanatory variables
Based on existing literature and keeping the objectives of the study in view, various demographic and socioeconomic factors are considered as determinants of the nourishment status of children. Table 1 below contains the details of the covariates included in this study along with the details of their coding schemes indicating the measuring process [7].
| Sr. no | Covariates | Measurements |
|---|---|---|
| 1 | Divisions | Bahawalpur=1, DG Khan=2, Faisalabad=3, Gujranwala=4, Lahore=5, Multan=6, Rawalpindi=7, Sahiwal=8, Sargodha=9 |
| Child history | ||
| 2 | Child age in months | 0-5=1, 6-23=2, above 23=3 |
| 3 | Child ill with fever during the last two weeks before the interview | Yes=1, no=0 |
| 4 | Child had diarrhea during the last two weeks before the interview | Yes=1, no=0 |
| 5 | Food diversity | None=0, anyone=1, any two=2, any three=3, at least four=4 |
| 6 | Size of child at birth | Above average=1, average=2, below average=3 |
| Mother education and health awareness | ||
| 7 | Mother education | None/pre-school=1, primary=2, middle=3, secondary=4, higher=5 |
| 8 | Child having mothers those who received antenatal care during pregnancy | Yes=1, no=0 |
| Household socio-economic status | ||
| 9 | Household wealth quintile index | Poorest=1, poor=2, middle=3, rich=4, richest=5 |
| 10 | Household own agricultural land | Yes=1, no=0 |
Table 1. Explanatory variables and coding schemes.
Quantification of food diversity: Over the last two decades variety of measures of food consumption diversity, focusing different dimensions of nutrition, have been defined. More recently, WHO proposed IYCF food diversity index based on genetic family membership of variety of food subgroups ensuring the food richness, see also Swindale and Bilinsky. Using the available information about the food consumption history of child in MICS (2017-2018) data, we arranged food items into seven major groups based on IYCF guidelines. These food groups are (1) roots, tubers and grains; (2) nuts and legumes; (3) flesh foods (poultry, liver/organ meats and fish); (4) eggs; (5) vegetables, vitamin A and rich fruits; (6) dairy products (yogurt, milk and cheese); (7) other vegetables and fruits. The value “0” is assigned to indicate the non-utilization of food item according to IYCF guidelines. Further, the food quality is ranked less diverse if food intake is supported through less than four groups and is assigned a value of “1”. Whereas the food quality is considered as diversified and enriched, if a child is consuming food items from at least four groups [8].
Ordinal regression models
In this study, since response variable is measured on ordinal scale to identify the priority groups existent in the population therefore, we employ variety of modeling schemes capable of entertaining the underlying hierarchy. We studied Proportional Odds Model (POM), Non-Proportional Odds Model (NPOM), Unconstrained Partial Proportional Odd Models (UPPOM) and Constrained Partial Proportional Odd Models (CPPOM), in the search of most appropriate schemes to model the nutrition status of children [9].
Proportional Odds Model (POM)
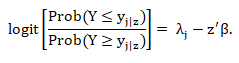
The POM is conventionally used when the parallel line assumption is satisfied in ordered outcome variable, that is, if rate of change remains constant among all categories of response variable, Bender and Grouven. In general, POM can be written as:
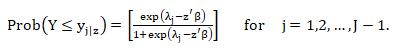
Where Y is vector compiling the categories of outcome variable and z' represents the covariates associated with j'th category of outcome variable. Further, β=(β1,β2,…,βk)' denotes parameters associated with covariates. Moreover, λj represents the unknown parameter, such as λ1 ≤ λ2 ≤ … ≤ λ(j-1) highlighting the ordered threshold [10-15]. On further simplification, we write the above given cumulative formation as follows,
Non-Proportional Odds Model (NPOM)
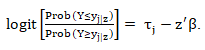
The NPOM models allows the relaxation of parallel lines assumption Fu, et al. The generalized model is expressed in the following equation:
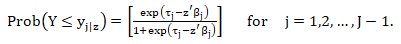
Where, τj maintains the ordinal structure by allowing the estimation of non-equivalent odds across the cumulative categories of response variable. A more workable expression of the model is derived after some simplification, as follows,
Un-constrained Partial Proportional Odds Model (UPPOM)
The UPPOM are applicable when parallel lines assumption holds for some covariates but need to relax for others and thus provides more general working environment as compared to the aforementioned models, Ananth and Kleinbaum. The objective is achieved by defining two distinctive groups of coefficients, such as.
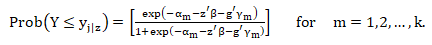
Here, Z is a vector of covariates satisfying the parallel lines assumption, whereas g is a vector containing the covariates not satisfying the parallel lines assumption. In the above model, γm explains the increment changes in logit for non-proportional variables. When the parallel line assumption is justified and the γm=0 , the model is treated as POM, Peterson and Harrell Jr.
Constrained Partial Proportional Odds Model (CPPOM)
The CPPOM is transformed unconstrained model and capably reduces the number parameters involved in the estimation of overall model. The transformation is attained by multiplying the coefficients at varying cut-points by a predetermined fixed scalar, Ananth and Kleinbaum. A general mathematical form of the model is described below:

Here, Γm is the predetermined scalar and g vector is q scaled, where cumulative logits are computed by multiplying γ and Γm.
Exploratory analysis
Child history: Table 2 comprehends the results of exploratory analysis of the MICS (2017-2018) data for Punjab. We observe a significant association between child age and their nutrition status. Children of smaller age groups are more likely suffer malnutrition as compared to higher age categories. These findings indicate that children of age 0–5 months are more fragile than other groups and thus become the priority group with respect to age. Further, there is statistically significant association between child suffering from fever in last two weeks and malnutrition. Also, diarrhea is witnessed to be significantly associated with nutrition status of children. A child suffered from diarrhea is more likely to face malnutrition than those who did not suffered [16]. Similarly, we found statistically significant association between child size at birth and nutrition status of child. The children with below average size at birth remained more vulnerable towards malnutrition as compared to children with average and above average size at birth. Overall, we may say that child health history emerged as significant determinant of child nutrition status.
| Covariates | Not malnourished | Moderate malnourished | Severely malnourished | Total | |||
|---|---|---|---|---|---|---|---|
| Percent | Frequency | Percent | Frequency | Percent | Frequency | ||
| 0–5 | 73.8 | 3181 | 14.9 | 643 | 11.3 | 486 | 4310 |
| 6–23 | 80.1 | 8574 | 13.4 | 1432 | 6.6 | 703 | 10709 |
| Above 23 | 78.9 | 8038 | 15.5 | 1577 | 5.7 | 577 | 10192 |
| Chi-squared P-value (<0.001) | |||||||
| No | 79.2 | 14376 | 14.2 | 2574 | 6.6 | 1202 | 18152 |
| Yes | 76.7 | 5417 | 15.3 | 1078 | 8 | 564 | 7059 |
| Chi-squared P-value (<0.001) | |||||||
| No | 79.2 | 16829 | 14.1 | 2991 | 6.7 | 1424 | 21244 |
| Yes | 74.7 | 2964 | 16.7 | 661 | 8.6 | 342 | 3967 |
| Chi-squared P-value (<0.001) | |||||||
| No | 69.4 | 2025 | 19.3 | 562 | 11.3 | 329 | 2916 |
| Yes | 79.7 | 17768 | 13.9 | 3090 | 6.4 | 1437 | 22295 |
| Chi-squared P-value (<0.001) | |||||||
| No | 77.2 | 13075 | 15.4 | 2615 | 7.3 | 1,243.00 | 16933 |
| Yes | 81.2 | 6718 | 12.5 | 1037 | 6.3 | 523 | 8278 |
| Chi-squared P-value (<0.001) | |||||||
| None | 71.8 | 7836 | 18.6 | 2026 | 9.6 | 1050 | 10912 |
| Primary | 79 | 4130 | 14.7 | 770 | 6.2 | 326 | 5226 |
| Middle | 83 | 2198 | 11.3 | 299 | 5.7 | 151 | 2648 |
| Secondary | 86.5 | 2880 | 9.4 | 314 | 4.1 | 137 | 3331 |
| Higher | 88.8 | 2749 | 7.9 | 243 | 3.3 | 102 | 3094 |
| Chi-squared P-value (<0.001) | |||||||
| None | 73.4 | 4196 | 15.1 | 861 | 11.6 | 663 | 5720 |
| Any one | 77.9 | 2803 | 15.1 | 544 | 7 | 250 | 3597 |
| Any two | 81 | 2261 | 13.1 | 367 | 5.9 | 164 | 2792 |
| Any three | 84.3 | 1486 | 11.2 | 197 | 4.5 | 79 | 1762 |
| Atleast four | 79.8 | 9047 | 14.8 | 1683 | 5.4 | 610 | 11340 |
| Chi-squared P-value (<0.001) | |||||||
| Above average | 85.1 | 1560 | 11 | 202 | 3.9 | 72 | 1834 |
| Average | 79.9 | 15269 | 13.9 | 2648 | 6.2 | 1,189 | 19106 |
| Below average | 69.4 | 2964 | 18.8 | 802 | 11.8 | 505 | 4271 |
| Chi-squared P-value (<0.001) | |||||||
| Poorest | 68 | 4215 | 20.9 | 1296 | 11.1 | 688 | 6199 |
| Poor | 75.4 | 4140 | 16.6 | 910 | 8 | 439 | 5489 |
| Middle | 82.7 | 4428 | 11.9 | 636 | 5.5 | 292 | 5356 |
| Rich | 84.4 | 3898 | 11.1 | 512 | 4.5 | 209 | 4619 |
| Richest | 87.7 | 3112 | 8.4 | 298 | 3.9 | 138 | 3548 |
| Chi-squared P-value (<0.001) | |||||||
| Bahawalpur | 70 | 1514 | 19.9 | 430 | 10.1 | 218 | 2162 |
| DG Khan | 73 | 2152 | 18.4 | 542 | 8.6 | 254 | 2948 |
| Faisalabad | 78.1 | 2445 | 15.1 | 474 | 6.8 | 212 | 3131 |
| Gujranwala | 83.3 | 3438 | 11.5 | 475 | 5.1 | 212 | 4125 |
| Lahore | 80 | 2530 | 13.8 | 436 | 6.2 | 196 | 3162 |
| Multan | 75.8 | 2303 | 15 | 456 | 9.2 | 278 | 3037 |
| Rawalpindi | 86.9 | 2172 | 8.2 | 204 | 4.9 | 123 | 2499 |
| Sahiwal | 80.3 | 1358 | 14.3 | 241 | 5.4 | 92 | 1691 |
| Sargodha | 76.6 | 1881 | 16 | 394 | 7.4 | 181 | 2456 |
| Chi-squared P-value (<0.001) | |||||||
| Total | 78.5 | 19793 | 14.5 | 3652 | 7 | 1766 | 25211 |
Table 2. Bivariate analysis of children’s nourishment status with respect to the explanatory factors.
Mother education and health awareness: A significant association is witnessed between mother education and nutrition status of children. We observe a consistent decrease in the proportion of malnutrition children having mothers with higher education. Similar patterns in nutrition status are found with respect to mother health awareness. Children with mothers having received antenatal care during pregnancy are less likely to suffer malnutrition as compared to their other peers.
Household socio-income status: Household socio-economic standing is also found a significant associate of child nutrition status. Children of families with higher wealth quartile are less likely to expose to malnutrition. Also, ownership of agricultural land significantly associates with nutrition status of child.
Statistical modelling
In this section, we further proceed our investigation through the employment of more appropriate regression strategies. First, we used POM to explore the children nourishment status with respect to aforementioned covariates. The Table 3 presents the results of POM.
| Covariates | Estimates | Standard errors | Odds ratios | 95% C.I (OR) |
|---|---|---|---|---|
| Intercept1 | 0.151*** | 0.133 | ||
| Intercept2 | 1.494*** | 0.134 | ||
| Child's monthly age (Above 23 months as reference) | ||||
| 0-5 | -0.237* | 0.107 | 0.79* | 0.641-0.972 |
| 06-11 | -0.351*** | 0.092 | 0.705*** | 0.589-0.843 |
| Child ill with fever in last two weeks (No as reference) | ||||
| Yes | 0.078* | 0.036 | 1.081* | 1.008-1.16 |
| Child had diarrhea in last two weeks (No as reference) | ||||
| Yes | 0.124** | 0.044 | 1.132** | 1.04-1.232 |
| Received Antenatal Care (No as reference) | ||||
| Yes | -0.239*** | 0.047 | 0.788*** | 0.72-0.863 |
| Household has own agriculture land (No as reference) | ||||
| Yes | -0.237*** | 0.035 | 0.79*** | 0.738-0.846 |
| Mother's education (None as reference) | ||||
| Primary | -0.158*** | 0.043 | 0.854*** | 0.786-0.929 |
| Middle | -0.287*** | 0.062 | 0.752*** | 0.667-0.847 |
| Secondary | -0.455*** | 0.064 | 0.635*** | 0.561-0.718 |
| Higher | -0.577*** | 0.074 | 0.562*** | 0.487-0.649 |
| Food diversity score (None as reference) | ||||
| Any one | -0.301*** | 0.059 | 0.741*** | 0.66-0.832 |
| Any two | -0.377*** | 0.068 | 0.687*** | 0.602-0.784 |
| Any three | -0.512*** | 0.082 | 0.6*** | 0.512-0.704 |
| At least four | -0.667*** | 0.1 | 0.514*** | 0.423-0.625 |
| Size of child at birth (Above average as reference) | ||||
| Average | 0.318*** | 0.07 | 1.375*** | 1.2-1.574 |
| Below average | 0.816*** | 0.075 | 2.26*** | 1.952-2.616 |
| Wealth quintile (Poorest as reference) | ||||
| Poor | -0.231*** | 0.044 | 0.795*** | 0.729-0.866 |
| Middle | -0.51*** | 0.053 | 0.601*** | 0.543-0.666 |
| Rich | -0.535*** | 0.061 | 0.587*** | 0.521-0.66 |
| Richest | -0.66*** | 0.076 | 0.518*** | 0.447-0.6 |
| Divisions (Bahawalpur as reference) | ||||
| DG Khan | -0.231*** | 0.065 | 0.794*** | 0.7-0.902 |
| Faisalabad | -0.171* | 0.066 | 0.844* | 0.742-0.96 |
| Gujranwala | -0.269*** | 0.067 | 0.765*** | 0.671-0.871 |
| Lahore | -0.131 | 0.069 | 0.878 | 0.768-1.004 |
| Multan | -0.105 | 0.065 | 0.901 | 0.794-1.024 |
| Rawalpindi | -0.532*** | 0.08 | 0.588*** | 0.503-0.687 |
| Sahiwal | -0.396*** | 0.079 | 0.674*** | 0.577-0.786 |
| Sargodha | -0.22** | 0.069 | 0.804** | 0.703-0.919 |
| Goodness of fit (Likelihood ratio); χ² (28)=1456.22; P-Value=<0.0001; Pseudo R-squared=0.044; n=25211 | ||||
| *, ** and *** indicates p<0.05, p<0.01 and p<0.001, respectively. | ||||
Table 3. The results of POM.
As a pre-requisite to POM, before interpreting the results the legitimacy of parallel line assumption was tested through Brant test. We found that the basic assumption of the POM does not hold for the MICS (2017-2018) Punjab based data. The Table 4 presents the results of Brant test.
| Covariates | Chi-Squared | P-values |
|---|---|---|
| Child's age | 3.78 | 0.052 |
| Child ill with fever | 1.22 | 0.27 |
| Child had diarrhea | 0.69 | 0.405 |
| Received antenatal care | 3.93 | 0.047 |
| Own agriculture land | 3.4 | 0.065 |
| Mother education | 0.09 | 0.758 |
| Food diversity score | 9.7 | 0.002 |
| Size of child at birth | 10.41 | 0.001 |
| Wealth quintile | 0.24 | 0.628 |
| Divisions | 2.21 | 0.138 |
| Overall | 106.46 | <0.0001 |
Table 4. Brant test results.
Due to the violation of parallel line assumption, we proceed by using NPOM as an alternative to the POM. The Table 5 compiles the outcomes. NPOM results shows that the odds ratios associated with the variables child's age, mother education and wealth index quintile vary for each category of the response.
| Comparisons | ||||||||
|---|---|---|---|---|---|---|---|---|
| Covariates | Not malnourished vs. (Severely and moderately malnourished) | (Not and moderately malnourished) vs. severely malnourished | ||||||
| Estimates | Standard errors | Odds ratios | 95% C.I (OR) | Estimates | Standard errors | Odds ratios | 95% C.I (OR) | |
| Intercept | -0.17 | 0.134 | -1.38*** | 0.228 | ||||
| Child's monthly age (above 23 as reference) | ||||||||
| 0-5 | -0.254* | 0.108 | 0.777* | 0.63-0.958 | -0.208 | 0.185 | 0.813 | 0.567-1.166 |
| 06-11 | -0.359*** | 0.093 | 0.7 | 0.584-0.838 | -0.365* | 0.168 | 0.695* | 0.501-0.964 |
| Child ill with fever in last two weeks (No as reference) | ||||||||
| Yes | 0.073* | 0.037 | 1.075* | 1.001-1.154 | 0.137* | 0.057 | 1.147* | 1.026-1.282 |
| Child had diarrhea in last two weeks (No as reference) | ||||||||
| Yes | 0.129** | 0.044 | 1.137** | 1.044-1.239 | 0.092 | 0.068 | 1.097 | 0.961-1.251 |
| Received antenatal care (No as reference) | ||||||||
| Yes | -0.224*** | 0.047 | 0.8*** | 0.73-0.877 | -0.344*** | 0.069 | 0.71*** | 0.621-0.813 |
| Household has own agriculture land (No as reference) | ||||||||
| Yes | -0.246*** | 0.036 | 0.783*** | 0.731-0.839 | -0.164** | 0.056 | 0.849** | 0.762-0.946 |
| Mother's education (None as reference) | ||||||||
| Primary | -0.151** | 0.044 | 0.861** | 0.791-0.937 | -0.244** | 0.071 | 0.784** | 0.684-0.9 |
| Middle | -0.293*** | 0.062 | 0.747*** | 0.662-0.842 | -0.204* | 0.098 | 0.817* | 0.675-0.988 |
| Secondary | -0.454*** | 0.064 | 0.636*** | 0.562-0.72 | -0.471*** | 0.106 | 0.625*** | 0.508-0.769 |
| Higher | -0.574*** | 0.074 | 0.564*** | 0.488-0.651 | -0.632*** | 0.125 | 0.532*** | 0.417-0.678 |
| Food diversity score (None as reference) | ||||||||
| Any One | -0.259*** | 0.06 | 0.773*** | 0.687-0.868 | -0.558*** | 0.091 | 0.573*** | 0.48-0.684 |
| Any Two | -0.338*** | 0.068 | 0.714*** | 0.625-0.815 | -0.61*** | 0.105 | 0.544*** | 0.443-0.668 |
| Any Three | -0.47*** | 0.083 | 0.626*** | 0.533-0.735 | -0.808*** | 0.135 | 0.447*** | 0.343-0.581 |
| At least Four | -0.62*** | 0.101 | 0.539*** | 0.443-0.655 | -1.064*** | 0.175 | 0.346*** | 0.246-0.487 |
| Size of child at birth (Above average as reference) | ||||||||
| Average | 0.313*** | 0.07 | 1.367*** | 1.193-1.567 | 0.387** | 0.125 | 1.472** | 1.153-1.88 |
| Below average | 0.789*** | 0.076 | 2.2*** | 1.899-2.55 | 0.977*** | 0.131 | 2.655*** | 2.056-3.429 |
| Wealth quintile (Poorest as reference) | ||||||||
| Poor | -0.23*** | 0.045 | 0.795*** | 0.729-0.868 | -0.228** | 0.069 | 0.797** | 0.697-0.911 |
| Middle | -0.508*** | 0.053 | 0.602*** | 0.543-0.668 | -0.509*** | 0.084 | 0.602*** | 0.511-0.709 |
| Rich | -0.53*** | 0.061 | 0.589*** | 0.523-0.664 | -0.586*** | 0.099 | 0.557*** | 0.459-0.676 |
| Richest | -0.662*** | 0.076 | 0.517*** | 0.445-0.599 | -0.594*** | 0.124 | 0.553*** | 0.434-0.705 |
| Divisions (Bahawalpur as reference) | ||||||||
| DG Khan | -0.236*** | 0.066 | 0.79*** | 0.695-0.899 | -0.195 | 0.101 | 0.824 | 0.677-1.003 |
| Faisalabad | -0.181** | 0.067 | 0.836** | 0.733-0.952 | -0.137 | 0.104 | 0.873 | 0.713-1.069 |
| Gujranwala | -0.282*** | 0.068 | 0.755*** | 0.661-0.861 | -0.177 | 0.107 | 0.839 | 0.681-1.034 |
| Lahore | -0.143* | 0.07 | 0.868* | 0.758-0.993 | -0.047 | 0.109 | 0.955 | 0.772-1.182 |
| Multan | -0.138* | 0.066 | 0.872* | 0.766-0.992 | 0.1 | 0.099 | 1.106 | 0.912-1.34 |
| Rawalpindi | -0.562*** | 0.08 | 0.571*** | 0.488-0.668 | -0.202 | 0.123 | 0.818 | 0.644-1.04 |
| Sahiwal | -0.4*** | 0.08 | 0.671*** | 0.574-0.784 | -0.425** | 0.131 | 0.654** | 0.506-0.846 |
| Sargodha | -0.228** | 0.07 | 0.797** | 0.696-0.913 | -0.18 | 0.108 | 0.836 | 0.677-1.032 |
| Goodness of fit (likelihood ratio); χ² (56)=1588.84; P-Value=<0.0001; Pseudo R-squared=0.0480; n=25211 | ||||||||
| *, ** and *** indicates p<0.05, p<0.01 and p<0.001, respectively. | ||||||||
Table 5. The results of NPOM.
Motivated by the overall outcomes, next we consider more sophisticated modeling scheme to handle the situation where, parallel lines assumption is violated for some variables but holds for other. The Table 6 summarizes the results for PPOM.
| Comparisons | ||||||||
|---|---|---|---|---|---|---|---|---|
| Covariates | Not malnourished vs. (Severely and moderately malnourished) | (Not and moderately malnourished) vs. severely malnourished | ||||||
| Estimates | Standard errors | Odds ratios | 95% C.I (OR)% | Estimates | Standard errors | Odds ratios | 95% C.I (OR) | |
| Intercept | -0.17 | 0.13 | -1.369*** | 0.221 | ||||
| Child's monthly age (Above 23 as reference) | ||||||||
| 0-5 | -0.25* | 0.11 | 0.777* | 0.63-0.958 | -0.253* | 0.107 | 0.777* | 0.63-0.958 |
| 06-11 | -0.36*** | 0.09 | 0.7*** | 0.584-0.838 | -0.358*** | 0.093 | 0.7*** | 0.584-0.838 |
| Child ill with fever in last two weeks (No as reference) | ||||||||
| Yes | 0.08* | 0.036 | 1.082* | 1.008-1.161 | 0.079* | 0.036 | 1.082* | 1.008-1.161 |
| Child had diarrhea in last two weeks (No as reference) | ||||||||
| Yes | 0.13** | 0.044 | 1.133** | 1.041-1.233 | 0.125** | 0.044 | 1.133** | 1.041-1.233 |
| Received antenatal care (No as reference) | ||||||||
| Yes | -0.24*** | 0.047 | 0.788*** | 0.72-0.862 | -0.24*** | 0.047 | 0.788*** | 0.72-0.862 |
| Household has own agriculture land (No as reference) | ||||||||
| Yes | -0.24*** | 0.035 | 0.79*** | 0.738-0.845 | -0.237*** | 0.035 | 0.79*** | 0.738-0.845 |
| Mother's education (None as reference) | ||||||||
| Primary | -0.16*** | 0.043 | 0.854*** | 0.785-0.928 | -0.159*** | 0.043 | 0.854*** | 0.785-0.928 |
| Middle | -0.29*** | 0.061 | 0.751*** | 0.667-0.847 | -0.287*** | 0.061 | 0.751*** | 0.667-0.847 |
| Secondary | -0.46*** | 0.063 | 0.635*** | 0.561-0.718 | -0.455*** | 0.063 | 0.635*** | 0.561-0.718 |
| Higher | -0.58*** | 0.074 | 0.562*** | 0.487-0.648 | -0.578*** | 0.074 | 0.562*** | 0.487-0.648 |
| Food diversity score (None as reference) | ||||||||
| Any One | -0.26*** | 0.06 | 0.772*** | 0.687-0.868 | -0.556*** | 0.091 | 0.575*** | 0.482-0.685 |
| Any Two | -0.338*** | 0.068 | 0.714*** | 0.625-0.815 | -0.611*** | 0.105 | 0.544*** | 0.443-0.667 |
| Any Three | -0.471*** | 0.083 | 0.625*** | 0.532-0.734 | -0.792*** | 0.135 | 0.454*** | 0.349-0.59 |
| At least Four | -0.62*** | 0.101 | 0.539*** | 0.443-0.656 | -1.074*** | 0.176 | 0.342*** | 0.243-0.482 |
| Size of child at birth (Above average as reference) | ||||||||
| Average | 0.312*** | 0.07 | 1.366*** | 1.193-1.566 | 0.404** | 0.125 | 1.497** | 1.173-1.91 |
| Below average | 0.788*** | 0.076 | 2.199*** | 1.898-2.549 | 0.988*** | 0.13 | 2.686*** | 2.082-3.464 |
| Wealth quintile (Poorest as reference) | ||||||||
| Poor | -0.23*** | 0.044 | 0.796*** | 0.73-0.867 | -0.23*** | 0.044 | 0.796*** | 0.73-0.867 |
| Middle | -0.508*** | 0.053 | 0.603*** | 0.544-0.668 | -0.508*** | 0.053 | 0.603*** | 0.544-0.668 |
| Rich | -0.534*** | 0.061 | 0.587*** | 0.522-0.661 | -0.534*** | 0.061 | 0.587*** | 0.522-0.661 |
| Richest | -0.658*** | 0.076 | 0.519*** | 0.447-0.601 | -0.658*** | 0.076 | 0.519*** | 0.447-0.601 |
| Divisions (Bahawalpur as reference) | ||||||||
| DG Khan | -0.229*** | 0.065 | 0.796*** | 0.701-0.903 | -0.229*** | 0.065 | 0.796*** | 0.701-0.903 |
| Faisalabad | -0.173** | 0.066 | 0.842** | 0.741-0.958 | -0.173** | 0.066 | 0.842** | 0.741-0.958 |
| Gujranwala | -0.269*** | 0.067 | 0.765*** | 0.671-0.871 | -0.269*** | 0.067 | 0.765*** | 0.671-0.871 |
| Lahore | -0.131 | 0.069 | 0.878 | 0.769-1.004 | -0.131 | 0.069 | 0.878 | 0.769-1.004 |
| Multan | -0.107 | 0.065 | 0.899 | 0.792-1.021 | -0.107 | 0.065 | 0.899 | 0.792-1.021 |
| Rawalpindi | -0.532*** | 0.08 | 0.588*** | 0.504-0.687 | -0.532*** | 0.08 | 0.588*** | 0.504-0.687 |
| Sahiwal | -0.396*** | 0.079 | 0.674*** | 0.577-0.786 | -0.396*** | 0.079 | 0.674*** | 0.577-0.786 |
| Sargodha | -0.22** | 0.069 | 0.803** | 0.703-0.918 | -0.22** | 0.069 | 0.803** | 0.703-0.918 |
| Goodness of fit (likelihood ratio); χ² (36)=1553.05; P-Value=<0.0001; Pseudo R-squared=0.0469; n=25211 | ||||||||
| *, ** and *** indicates p<0.05, p<0.01 and p<0.001, respectively. | ||||||||
Table 6. The results of PPOM.
Determinants of child nutrition status
We observed that the employed models, POM, NPOM and PPOM, reveal that all the covariates are significant predictors of malnutrition. While goodness of fit indicators is in favor of PPOM, therefore, we interpret the coefficients given in PPOM. The Table 7 shows the values of goodness of fit criteria for each model.
| Models | |||
|---|---|---|---|
| Measures | POM | NPOM | PPOM |
| Deviance | 31623.11 | 31490.5 | 31526.28 |
| McFadden-R2 | 0.044 | 0.048 | 0.048 |
| AIC | 31683.11 | 31606.5 | 31602.28 |
| BIC | 31927.16 | 32078.3 | 31911.41 |
Table 7. Goodness of fit summary.
The PPOM results from Table 6 shows that the odds of falling in poor nourishment status are lowest for the children who consumed diversified diet as compared to the children who consumed none of the food item. These odds of malnutrition are 46% lower for the children who consumed at least four food groups as compared to the children whose dietary intake does not follow IYCF guidelines. This is observed when no malnutrition category is compared with moderate & severe malnutrition categories. Similarly, a consistent decrease in odds of malnutrition is observed with respect to other categories of food diversity. Such as 38% lower, 29% lower and 23% lower for the children who consumed at least any three food groups, any two food groups and anyone of the food group respectively as compared to the children with no consumption of any food. Furthermore, the odds are different when no malnutrition and moderate malnutrition categories are compared with severe malnutrition category. The results indicate that the children who consumed at least four food groups, any three food groups, any two food groups and anyone of the food group have 66%, 55%, 47% and 43% lower risk of malnutrition, respectively, as compared to children with no consumption of any food from these complementary food groups.
Table 6 shows that the odds of falling in poor nutritional status, that is, moderate or severe malnutrition states is lowest for the children with educated mother. As observed from the Table 6, the odds of staying in extreme malnutrition state are 44%, 37%, 25% and 15% lower for children having higher, secondary, middle, and primary educated mothers, respectively, as compared to the children having uneducated mothers. Further, when the no malnutrition category is compared with moderate & severe malnutrition categories, the children with below average and average size have 1.306- and 2.199-times higher risk of falling in poor nourishment status respectively as compared to the children having above average size. On the other hand, when the no malnutrition and moderate malnutrition states are compared with severe malnutrition state, these odds remain 1.497 and 2.686 times higher. Child’s health history and mother’s health awareness also significantly derive the likely status of nutrition. The children who had diarrhea and fever during the last two weeks have higher odds of suffering malnourishment as compared to the children with no such type of disease. Similarly, children whose mothers received antenatal care during pregnancy have 22% lower odds of being malnourished as compared to the children from mothers who have not received the care.
While measuring the impact of wealth index quintile, odds of having worse malnutrition status are 53%, 43%, 40% and 22% lower for the children from richest, rich, middle, and poor households, respectively, as compared to poorest households. The odds of falling in worse state of malnutrition are lowest in the richest households. The households having agriculture land have less percentage of malnourished children as compared to the households with no agriculture land. As results show that the children from these households have 23% lower odds of staying in worse state of malnutrition as compared to the households with no agriculture land. We also found significant variations in nutrition condition of children with respect to districts of the province.
Although, Punjab is the most developed province of Pakistan still the percentage of malnourished children is very high. Despite many initiatives, there is dearth of subjective and mixed methods studies on the causes of child malnourishment in Punjab. This research advances the existing literature, mainly on two fronts. Firstly, we advocate the use of ordinal scale to quantify the nutrition stat of children in order to facilitate the identification of priority groups existent in the population. Secondly, we use IYCF proposed food diversity index, an indicator of balanced food, to explore the child malnourishment in Punjab. We also have considered additional factors related to child health that were being ignored in previous studies. Keeping in mind the nature of response variable, several contemporary modeling schemes were employed to explore the underlying ordinal structure of the nourishment status of children. Based on several good fit criteria, partial proportional odd model was selected as more sophisticated technique among many. The results of PPOM show that balance and diverse food intake has significant relationship with child's nourishment. Similarly, factors such as, mother's education and awareness, child’s health history, household’s socio-income status, are significantly affecting child's nourishment status.
Based on the findings of this study, we recommend three folded schemes to support the goal of achieving better child nutrition status in Punjab. We highly advocate the propagation of the use of balance diet for children. This can be persuaded through media campaign and social awareness programs. Simultaneously, mother’s health awareness is an important factor. The lady health worker program can play a vital role in this regard. Thirdly, synchronized efforts are required to improve economic conditions at household level while providing enhanced opportunities of women empowerment. A more rigorous implication of the programs such as, EHSAAS and BISP while linking financial assistance to balanced diets among children is desirable.
[Crossref] [Google Scholar] [PubMed]
[Crossref] [Google Scholar] [PubMed]
[Crossref] [Google Scholar] [PubMed]
[Google Scholar] [PubMed]
[Crossref] [Google Scholar] [PubMed]
[Crossref] [Google Scholar] [PubMed]
[Crossref] [Google Scholar] [PubMed]
[Crossref] [Google Scholar] [PubMed]
[Crossref] [Google Scholar] [PubMed]
[Crossref] [Google Scholar] [PubMed]