Research & Reviews: Journal of Ecology and Environmental Sciences
ISSN: 2347-7830
ISSN: 2347-7830
Yadesa Akena*
Department of Forestry, Institute of Environment,Forest, and Climate Change, Gidame Woreda, Oromia, Ethiopia
Received: 17-Mar-2022, Manuscript No. JEAES-22-52609; Editor assigned: 20- Mar-2022, Pre QC No. JEAES-22-52609 (PQ); Reviewed: 01- Apr-2022, QC No. JEAES-22- 52609; Revised: 03-Apr-2022, Manuscript No. JEAES-22-52609 (A); Published: 10-Apr-2022, DOI: 10.4172/ 2347-7830.10.03.13
Visit for more related articles at Research & Reviews: Journal of Ecology and Environmental Sciences
The regeneration of natural forest is essential for maintaining forest ecosystem functioning, which is globally threatened by natural and human disturbance. Deforestation and forest degradation show an alarming high, mainly due to the conversion of natural forest to commercial and cereal crop production. By considering this issue this study was conducted with the aim to assess the effect of coffee expansion on regeneration of the natural forest ecosystem in Gidame woreda. The study site was stratified in two strata: undisturbed natural forest and disturbed coffee forest. A total of 71 nested square sample plot was determined, proportionally allocated (29 for undisturbed and 42 for disturbed/coffee forest) and randomly distributed within each stratum. In both cases, seedlings and saplings were counted, and the DBH of trees with greater than 5 cm DBH were measured. The independent two sampled t-test was performed in order to determine whether there was a significant difference between forest classes’ natural regeneration status by using the Least Significant Difference (LSD) of mean at p<0.05. The results showed that regeneration of undisturbed natural forest was good as the present in seedlings density greater than saplings greater than mature trees. The enumerated mean densities of seedlings, saplings, and mature trees in undisturbed natural forest were 4583 ± 67 plants/ha, 3287 ± 35 plants/ha and 740 ± 14 stems/ha respectively.
In the disturbed coffee forest, the density of seedlings less than saplings less than mature plants showed poor regeneration due to coffee management activities in natural forest. The mean densities of seedlings, saplings, and mature trees in disturbed coffee forest were 237 ± 7.3 plants/ha, 314 ± 73 plants/ha and 344 ± 15 stems/ha respectively. The seedlings, saplings and mature tree species densities in the disturbed coffee forest were decreased by 94.83%, 90.45%, and 53.51% respectively as compared to undisturbed natural forest. Therefore, maintaining the regeneration potential of this natural forest ecosystem should be required through the implementation of different conservation mechanisms.
Coffee management; Disturbed forest; Natural regeneration; Undisturbed forest
Natural forest is a multilayered vegetation dominated by trees (evergreen or semi-deciduous), whose combined strata overlapping crowns, and where grasses in the herbaceous stratum are generally rare [1]. It is reproduced naturally from the previous original forest cover, spontaneously generated itself on the location and which consists of indigenous tree species. Through a natural process, this native species reproduced by self-sown seeds, vegetative recovery, and coppice or root suckers. There are no clearly visible indications of human activities, and the ecological processes are not significantly disturbed [2]. In the absence of further disturbance and by avoiding replanting with exotic species, forests regain their diverse native status [3]. The natural tree composition, occurrence of dead woods and age structure are not disturbed; and the area of land is also large enough to maintain its natural characteristics [4]. Because, for many indigenous tree species natural regeneration is effective where near the parent plants were existed [5]. Native species that are adapted to the prevailing conditions re-establish on their growth following natural succession, leading to the recovery of native ecosystems [6].
Ethiopia is endowed with its high species diversities in natural forests. Because of its rugged highlands, different agro-ecologies in altitude ranges from Dalol depression (116 m below sea level) in the northeast Afar Region to 4,620 m above sea level in Semien mountain, rainfall pattern and soil variability; it has an immense ecological diversity and a huge wealth of biological resources. These are principally attributed to socioeconomic, cultural diversity and complex topography of the country. From these ecological diversities and diversities of plant species in natural forests, the South West Moist Afromontane forest of Ethiopia is the origin and genetic diversity of Coffea arabica species and named as the birthplace of r [7]. As a result, Ethiopia is known as one of the centers of the primary coffee plant domestication country in the world [8].
Even though Ethiopia has different vegetation types and species diversity of natural forests, these natural forest areas with the occurrence of wild coffee gene pools are under constant threats. Land use and land cover changes, including legal and illegal deforestation, and forest degradation are the most important factors that contribute to social, economic, and environmental challenges facing mankind in the recent century. This is largely due to anthropogenic factor, including coffee management intensification [9]. From the four coffee production systems, namely forest coffee, semi-forest coffee, garden coffee and plantation coffee; semi-forest coffee and plantation coffee management systems are the major causes of forest degradation in Ethiopia especially in the west part of the country [10]. Show that semi forest coffee management system decreases the forest basal area,tree regeneration, reduces tree density and eventually leads to the disappearance of the forest tree species. The only selected old trees of shade value are maintained, which eventually endangers the functions of the shade value. Because, at some point in time, a significant portion of the selected shade trees could be lost due to their old age.
The intensive coffee management under the selected shade trees heavily affects tree seedlings that could serve as future shade trees. The traditional coffee cultivation system, selective cuttings of some tree species which the farmers believe to reduce coffee production affects growing seedlings [10]. Rapid land-use conversion and modification in support of Agro-industrial developments lead to the removal of natural forest cover with a corresponding loss of natural regeneration [11]. These effects are being observed in some places in the country. The only preferred coffee shade trees Albizia gummifera, Acacia abyssinica, and Millettia ferruginea tree species are left in the rich biodiversity of the natural moist evergreen Afromontane forests of the South West Ethiopia [12]. The disappearance of this forest is threatening the communities that depend on natural forests for their livelihoods and affects water supply to lowland areas [13]. In Gidame woreda, local communities living near natural forest use the products of the natural forest for their livelihoods and the prohibition of harvesting the forest for timber and non-timber forest products. However, the main cause of the problem in the demarcated natural forest area is driven by the need to expand coffee cultivation in natural forest. Near to local people only the knowledge of understanding the ongoing processes at the forest margin as deforestation; but not to consider the extent of the persisting forest patch degradation. Land shortage in traditional farming system, rapid population growth, poor economic performance, and the need for economic growth were increase competition of encroachment for commercial coffee plantation among these people and converting natural forest to the coffee cultivation area to improve their livelihood economy. Due to these the evergreen moist montane forest of this woreda is under great threat of rapid degradation and converted to coffee cultivation area. Even though this Woreda has high coverage of natural forest, the forest is threatened by the pressure from coffee expansion. There is no study on how this conversion is affecting the regeneration of this natural forest. So this study was conducted with the aim assess the effect of coffee expansion and its management in natural forest on natural regeneration of woody species.
Study site
The study was conducted in Gidame woreda, in Kellem Wollega Zone, Oromia Region, Ethiopia, which is located at 688 km west of Addis Abeba. It is bordered on the North by Beghi woreda, on the South by Anfillo woreda, on the East by Jimma Horo woreda, and on the West by South Sudan country. Geographically it is located between 8° 38' 0" N to 9° 12' 0" N Latitude and 34° 10' 0" E to 34° 42' 0" E Longitude, altitude ranges 1500-2300 m above sea level and its town Gidame (Figure 1).

Figure 1: Map and geographical location of Gidame woreda and the study area of forest.

The major agro-ecologies of Gidame woreda are 8% Dega, 75% Woina-Dega and 17% Kolla. The maximum temperature ranges from 23 to 26°C with an average annual temperature of 25.2°C and the lowest annual temperature ranges from 7.6-19.8°C with an average of 12.16°C. The rain seasons are spring (March-May), summer (June-August) and autumn (September-November). The average annual rainfall of the district ranges between 941-1635 mm and uni-modal rainfall. Gidame woreda covers a total area of 219,031 hectares. From this total area of land 47,004 hectares covered by evergreen moist montane natural forest, 12,721 plantation forests, 59,872 hectares covered by coffee, 15,283 hectares grazing land, 71,584 hectares’ cropland and 12,567 hectares of other land uses.
Gidame woreda has twenty-eight rural and two towns administrative Kebeles; and an estimated total demographic population of 111,172 [14]. Out of this total population, 4,636 males and 4,404 female live in urban, 51,254 males and 50,878 female live in rural areas. The average population density of this woreda is 51 persons/ km2. The largest ethnic group is the Oromo people. Afan Oromo is spoken as the first language. The majority of the inhabitants observed Orthodox Christianity, with 70.89%, while 14.99% were Muslim, and 13.6% Protestant dwellers [15].
Like in most parts of Ethiopia, mixed farming (crop production and animal husbandry) dominates the livelihood of the woreda. The land is an important asset of households for the crop production, rearing of livestock and coffee production. The major crops grown include maize (Zia maize), Sorghum, teff (Eraguresive teff), barley (Hordeum vulgare), wheat (Triticum vulgare), pea (Pisum sativum), bean (Vicia faba), oats, millet, horse beans, haricot beans, chickpeas and root crop like potato (Selenium tuberosum), ‘ancote’, onion, cassava and coffee is the most an important cash crop of the district.
Sources of data
To achieve the objective of this study, both primary data and secondary quantitative data was used. The primary data were obtained from the forest inventory based field surveys and observation in the study area forest which covers 4 (Kebeles) of the woreda by using a nondestructive method of data collection technique. The secondary data were obtained from published previous stock assessment journals, thesis and project reports on evergreen moist Afro-montane forests in Ethiopia for sample intensity determination.
Sample size determination, sampling techniques, and design
A preliminary survey was carried out within the study area for deciding the proper type of design and intensity of sampling that was appropriate for achieving the objective of the study regarding the natural attributes of vegetation type and forest coverage. The boundary and area of the study site [16]. Were determined and delineated on its base map which covers four (4) Kebeles of Gidame Woreda [17,18]. Naturally, the agro-ecology and vegetation characteristics of this forest ecosystem were no difference except the influences of year to year coffee expansion and management activities. It is dominated by very large trees such as Aningeria adolfifriedericii, Apodytes dimidiata, Albizia gummifera, Olea welwitschii, Strychnos spinosa and consists of other shrubs, lianas and different size tree species composition with different layers of canopies. The objective-based stratified random sampling was applied to get a representative sample from the two strata or compartments of the study site. Thus, the study site was stratified into two strata, or compartments of closed forest (i.e., undisturbed natural forest) and disturbed natural forest (i.e., where converted to coffee) depending upon anthropogenic factors (disturbance history) to make homogeneous characteristics and available for comparison by using GPS control points.
A reasonable balance of the appropriate simplicity nested square plot-size rules presented in the Table 1, that can be applied to any forest research was used for sample plot size, to include all the data of vegetation types, tree size and tree species grown in this natural forest [19]. Because it is easily established and the real boundaries around the plot are marked by using meter tape and rope during the layout rather than the circular plot. It also has higher area coverage than a rectangular plot with the same perimeters. This decreases the edge effect of the sampling error and increases the quality of collected data (Table 1).
| Stem diameter | Square plot | Area (m2) | Area (hectare) |
|---|---|---|---|
| Seedlings, saplings and trees 5-20 cm dbh | 7 m × 7 m | 49 | 0.0049 |
| Trees 21-50 cm dbh | 25 m ×25 m | 625 | 0.0625 |
| Trees>51 cm dbh | 35 m ×35 m | 1225 | 0.1225 |
Table 1. Nested square plot-size desired and used for data collection.
After the sample plot shape and the sample plot area were determined, the required sufficient number of representative sample plot intensity was calculated for adopting a stratified random sampling method by using the next area based formula [20].
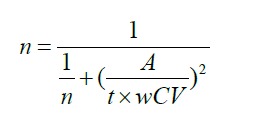
Where: n = the required number of total sample plots, A=allowable error in percent (10%), t=the sample statistics from the t-distribution for 95% confidence level, t is usually set at 2 as sample size is unknown at this stage, N= total number of sampling unit in the study area (i.e., the study area 5,176 ha divided by the area of a single plot 0.1225 ha (5176 ha/0.1225 ha=42253)), and WCV=Weighted Coefficient of Variation 42 it was calculated for both compartments from empirical secondary cruise data sources of different previous studies of various nondegraded and degraded moist Afromontane forest and remnant forest ecosystems in Ethiopia which are similar to forest ecosystem of the present study site. To get a representative number of samples from the two strata or compartments, these total sample plots were proportionally allocated depending upon the area coverage of the stratum (Table 2).
| Forest compartment | Area (ha) | Ni | Area fraction (Afi) | CVi | |
|---|---|---|---|---|---|
| undisturbed natural forest | 2064 | 16849 | 0.4 | 42 | 29 |
| disturbed /coffee forest | 3112 | 25404 | 0.6 | 41 | 42 |
| Total (A, Ni and wcv) | 5176 | 42253 | 1 | 42 | 71 |
Note: Ni= sampling frame, A=Area in hectare, Wcv=weighted coefficient of variation, Afi= area fraction, CVi= coefficient of variation for each stratum, ni=number of sample plot for each stratum.
Table 2. Area-based proportional alloca
tion of sample plot densities used for both strata/or compartments.
The estimated numbers of sample plots were spatially distributed on a base map of the study area by using a stratified random sampling approach for both strata using GRASS QGIS 3.2 version software research tool vector menu as shown in Figure 2. The X and Y coordinates of all these generated sample points were recorded (Figure 2).

Figure 2: Randomly distributed sample plots on a base map of the study area.

The field survey checklist was prepared in a table format for measurements of quantitative data. Field note was also used to collect information about the collected data in a written format from observation. The positions of randomly distributed sample points were found by GPS guide on the ground. Field surveys in the selected sample station areas of the forest and personal observation were done to collect the relevant primary data for the study.
Plot establishment: Before delineating plot boundary a simple trigonometric calculation distance on the sloping ground was calculated by the desired length divided by the cosine of the angle of the slope (d = 35 m/cos θ) in the field for slope correction using a clinometer for inclined surface. Then after, as shown in Figure 3, the desired concentric nested square plots were constructed on the ground by using meter tape and rope. The nested square plot containing the smaller sub-units was used for recording discrete size classes of stems for including all forest composition of trees population characteristics in a single plot (Figure 3).

Figure 3: Layout of sample plot design on the ground used to collect data in Gidame forest ecosystem, western Ethiopia.
Data collection
Seedlings and saplings counting: For the status of natural forest regeneration assessment, the smaller nested square sub-plots having 7 m length and width inside the larger plot was used for seedlings and sapling data collection. The individual tree seedlings (height less than 1.5 m) and saplings (height between 1.5-3 m) were as considered seedlings and saplings respectively [21]. Which are less than 5 cm DBH were identified, enumerated, and recorded [22]. The Diameter at Breast Height (DBH) of woody plant species starting from small to large, living trees, climbers/Lianas, shrubs which are greater than 3 m in height and diameter classes of 5 cm to 20 cm DBH, 21-50 cm DBH, and greater than 51 cm DBH in the nested sample plots were properly measured, counted and recorded separately according to their stem diameter class specified in desired plot size.
Data analysis
The collected primary forest inventory data were analyzed and interpreted using quantitative statistics. The independent two sampled t-test was performed to determine whether there was significant difference between forest classes’ natural regeneration status. The statistical test for significance of difference was tested using the Least Significant Difference (LSD) of mean at p<0.05. Descriptive statistics percentage and descriptive tools charts were employed to summarize the results; and conclude with the forest disturbance indicators and supported by a concise discussion.
The means of seedlings, saplings and matured tree densities per hectare were calculated. The regeneration status of undisturbed natural forest and disturbed coffee forest was analyzed by comparing within groups and between groups’ of seedlings, saplings and plant species with mature plants.
Categories
If the present seedlings>saplings>mature trees “good regeneration”
If present in seedlings>saplings<mature trees “fair regeneration.” And
If a species survives only in the sapling stage “poor regeneration” but not as seedlings. Even though saplings may be less than; more than or equal to mature.
The densities (number of plants per hectare) of seedlings, saplings and mature plant species in both forest classes were determined. The enumerated mean density of seedlings less than 1.5 m in height were 4583 ± 67 plants/ha in undisturbed forest and 237 ± 7.3 plants/ha in disturbed or coffee forest. Based on two-sampled ttest, the density of seedlings in the undisturbed natural forest was significantly higher than in the disturbed or coffee forest (T=77.11 and p<0.05). The determined saplings (i.e., height between 1.5 - 3 m) mean densities were 3287 ± 35 plants/ha of undisturbed forest and 314 ± 73 plants/ha from the disturbed or the semi-forest. The density of saplings for undisturbed natural forest was also significantly higher than that of semi-forest or coffee forest as T=52.75 and p<0.05. There recorded mature plants 740 ± 14 stems/ha in the undisturbed natural forest was also greater than 344 ± 15 stems/ha in the disturbed coffee forest (T=18.41 and p<0.05). The seedlings, saplings densities and mature plant species in the disturbed coffee forest were decreased by 94.83%, 90.45% and 53.51% respectively as compared to the undisturbed natural forest.
The results demonstrated that undisturbed natural forest regeneration potential was higher than disturbed or coffee forest. In undisturbed natural forest, the abundance of seedlings densities was >saplings >mature trees as shown in Figure 4. Most of the woody tree species have the highest number of individuals at the seedlings and sapling stage with a gradual decrease or diminishing towards maturing. This indicated that the higher and better natural regeneration potential of undisturbed natural forest (Figure 4).

Figure 4: Population structure and growth size distribution of major trees species in undisturbed natural forest and disturbed coffee forest in terms of mean stem densities per hectare of Gidame woreda moist evergreen montane forest.
In the coffee forest, the regeneration of woody plants was poor since the number of seedlings < sapling < mature plants. This showed that the conversion of forest to coffee plantation and its management activities effect on regeneration of plant species in the study area of forest ecosystem. Frequent removal of naturally grown seedlings and saplings of plant species minimized the regeneration abundances and the shrub layer was replaced by coffee plants. The intermediate tree layer density was also minimized during coffee shad tree management activities for increasing coffee production and productivity. The only tree species with a single trunk and small leaves that can grow large in height densities were quite similar in both forest classes.
The regeneration of these study area forest classes have similar growth forms and compared with other natural forests in Ethiopia and tropical forests. But quite different with plant densities 22,630 plants/ha, 658 plants/ha, 635 plants/ha seedlings, saplings and mature plants respectively in natural forest; in coffee forest 7,110 plants/ha, 176 plants/ha and 402 plants/ha seedlings, saplings and mature plants respectively in Bale Ecoregion natural forest in Ethiopia [23]. The recorded regeneration abundances in this study site were comparable with the natural regeneration of tree species in Belete moist evergreen montane forest 4,547 seedlings/ha, 1,547 saplings/ha and 265 adults/ha [24]. Only the seedling densities in this study were lower than the least disturbed sites in the tropical forest of Chhattisgarh 39,500/ha seedlings, 490/ha saplings, and 510/ha mature trees; moderately disturbed seedlings 26,000/ha, sapling 610/ha, and tree 310/ha; and highly disturbed seedlings 7,750/ha, saplings 30/ha, and trees 100/ha [25]. These differences might be caused by differences in management practices, management intensities and degree of disturbances, vegetation characteristics, agroecology, and soil types.
The higher species densities recorded in undisturbed natural forest confirmed that with intensive management, the growth size-frequency distribution of some individual tree species was different from the cumulative growth size distribution [26]. The indigenous forests with least disturbed native forests have a much higher regenerating seedlings and saplings than in the most disturbed forest [27]. In a healthy ecosystem natural regeneration is an inbuilt part of the process that maintains the ecosystem, its communities of plants [28]. Human disturbance is a significant negative impact on forest regeneration. In coffee forest, under-story vegetation were removed and replaced with some coffee plants where shrubs were often more abundant than tree seedlings regarding the percentage of cover. During an opening phase in semi-forest coffee system, the vegetation which considered as it would have competed with coffee plants were cleared without preferential selection and replaced by coffee plants. Semi-forest coffee system, also disturb the forest structure of some upper canopy layer as farmers remove 30% of the canopy trees and most of the undergrowth vegetation except the coffee plants.
Habitat degradation reduces seedling densities, which appears to be associated with increased canopy disturbance. Fragmentation and degradation both appear to compromise the ability of the late succession trees to reproduce and persist in human-modified landscapes [29]. Most of the montane forest areas in South West Ethiopia have been deforested, and the remaining forest areas are highly fragmented [30]. Weeding under planted coffee removes seedlings and saplings from year to year and largely affected the natural regeneration of indigenous plant communities. The observed regeneration status of forest coffee showed that poor recruitment of mature trees by the saplings. Since trees densities and their regeneration in the forests were mostly dependent on the response of seedlings and saplings to the forest micro environment. These conditions confirm that, the seedlings from natural regeneration not likely survive unless on low hazard sites; disturbances influence the regeneration of forest stands. Saplings density is a good measure to notice influence of human disturbance on forest regeneration status [31-36].
Natural forest regeneration assessment is an important part of evaluations of forest status and needs for sustainable natural forest management as it is one of the thrusts full areas of forestry. It is also necessary for maintenance of biodiversity and promoting forest sustainability. Because successfully regenerating and conserving young trees is the first principle of sustainable forest management. Even though disturbance sometimes creates an environment for some light-demand species, too much and frequent disturbances minimize the overall tree diversity by eliminating sensitive and late succession plant species. The least disturbed forest site showed good regenerating because of the highest densities of seedlings and saplings in the forest site; moderately disturbed site shows better regeneration, but highly disturbed site did not show good regeneration status.
Coffee expansion in natural forest and its management activities significantly affect the natural regeneration of native tree species population of the natural forest ecosystem. The seedlings, saplings and mature plant species densities were decreased by 94.83%, 90.45%, and 53.51% respectively as compared to the undisturbed natural forest. In disturbed forest of this study site, the undergrowth vegetation, tree seedlings, and saplings were removed and replaced by coffee plants. Coffee expansion and its management activities also decrease forest characteristics: basal area and tree density which lead to minimize biodiversity based natural regeneration of indigenous tree species. Therefore, the results of this study strictly indicated that the conservation of this natural forest ecosystem and enhancing its regeneration potential should be widely recognized and needs other further investigation. Time to time regeneration status assessment of this forest patch should be needed to determine the status of the forest and take for appropriate conservation measures for the remaining natural forest. Reducing coffee expansion in this natural forest which destructs the natural regeneration of this natural forest and enhancing prioritization of forest conservation through local community participation and provision of environmental awareness for forest user groups should be provided. The attention on the need to achieve sustainable forest management should be adopted for the quality of the ecosystem services especially on biodiversity based regeneration potential of this natural forest.
First of all, I would like to say great thanks to Almighty God, the Creator, Ruler, and Lord of the universe, and who gave me the life, the health mind to think and the ability to do this paper. Secondly, my sincere gratitude goes to Dr. Motuma Tolera, for his great support and aids me by his professional guidance, advice, and encouragement in undertaking this study, especially for his strong follow during the writing up of all the research process and constructive comments on my paper. Finally, I want to express my warm feelings and great thanks to Ato Kasahun Terfasa for his daily support and kindly spared his time and effort during the lengthy process of forest inventory data fie ld collection.
[Crossref] [Google Scholar] [Pubmed]
[Crossref] [Google Scholar] [Pubmed]