T. Ramraj1*, S. Syed Jaffer2, R. Prabhakar3
1Department of Computer Science and Engineering, Amrita School of Computing, Amrita Vishwa Vidyapeetham, Coimbatore, India
2Department of Chemistry, Coimbatore Institute of Technology, Coimbatore, TamilNadu, India
3Department of Computer Science and Engineering, Coimbatore Institute of Technology, Coimbatore, TamilNadu, India
Received date: 14-Nov-2023, Manuscript No. JSMS-23-120070; Editor assigned: 16-Nov-2023, Pre QC No. JSMS-23-120070 (PQ); Reviewed: 30-Nov-2023, QC No. JSMS-23-120070; Revised: 17-Jan-2025, Manuscript No. JSMS-23-120070 (R); Published: 24-Jan-2025, DOI: 10.4172/JSMS.11.1.001
Citation: Ramraj T, et al. “Topological Stress” Concept for Quantizing Chemical Graph Similarity Scores. RRJ Stats Math Sci. 2025;11:001.
Copyright: © 2025 Ramraj T, et al. This is an open-access article distributed under the terms of the Creative Commons Attribution License, which permits unrestricted use, distribution and reproduction in any medium, provided the original author and source are credited.
Visit for more related articles at Research & Reviews: Journal of Statistics and Mathematical Sciences
Graph invariants can be used to infer molecular structural properties of graphs. In this work, a new distance metric between vertices of a graph is proposed to find the structural similarity between graphs. For this, a new distance matrix (known as IE matrix) is constructed based on the inverse Euclidean distance between graph vertices. This new representation directly depicts the skeletal structure of the vertices in the n-dimensional space. In this space, minimal distance between vertices implies high topological proximity between them. Based on IE matrix, a unique signature is generated for every graph which is used to find similarity between graphs. A new concept “Topological Stress” is introduced that reveals the topological variation of a vertex with other vertices. Using this stress concept, similar topological stressed vertices between different graphs are identified and further explains the methylalkane interconversion reactions with the help of signature and dominant Eigen value. The entirety of the matrix is represented as a singularity which may serve as a unique molecular index (IEGPr) for chemical graphs. Similarity between graphs are calculated based on their corresponding IEGPr values. The resultant quantified similarity score lies between 0 and 1, referring value 1 for exact isomorphic. From the computational study, it is observed that IEGPr value is generally very low implying a low-value nomenclature of chemical graphs. Empirical study shows that the computational time required for the similarity identification procedure is scalable. From this it can be inferred that by improvising/reframing this measure a few application oriented graph matching problems can be tackled in polynomial time/near-polynomial time.
Graph isomorphism; Graph signatures; Molecular topological index; Inverse euclidean matrix; Eigen values
This study emphasises on the fundamental entity of representing any chemical molecule and proposes a new invariant representations of chemical graphs (graph signatures) for finding similarity between graphs. In petro chemical industry, hydrocarbon is processed among which heptane (and its isomers) is one of the petrochemical entities. In this study, seven isomers of heptane are taken for consideration which vary with molecular structural topologies, boiling points and other physical properties. For each heptane isomers, a unique molecular descriptor is derived (graph signature) from which a topological index is framed. It is observed that the obtained signatures and their topological indexes are unique for individual isomers and are graph invariant. These descriptors are in turn used to check for structural similarity between heptane isomers, in polynomial time. Further investigation revealed that the signature not only depicts the structural properties but also embed some interesting features like topological stresses for each vertex which may be useful for solving sub-graph isomorphism problems. The philosophy of this work is to convey, if mathematical properties are coupled with physical properties of chemical graphs then more information can be inferred.
Generally, mathematical properties are expressed as numbers whereas matrices are most suited to represent chemical structures. Janezic et al., listed out various representation of graph theoretical matrices used in chemical graph theory (Table 1).
| Matrices used in chemistry |
Brief outline |
|---|---|
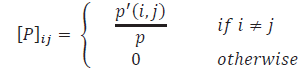
| Path | Matrix elements defined by shortest paths
• p-Total number of paths in G |
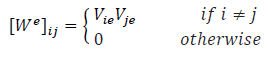
| Wiener (Edge-Wiener matrix) |
Matrix elements are given by the product of the number of vertices on each side of path from vertex i to vertex j. A sparse symmetric square matrix (denoted by We ) introduced mainly for acyclic graphs whose elements are defined by
Vie and Vje-The number of vertices in two sub-graphs after and edge e(i,j) is removed from the acyclic graph |
| Random walk | Asymmetrical matrix determined by probability of random walk from vertex i to vertex j |
| Natural Distance (ND) matrix | Distance between vertices in n-dimensional space |
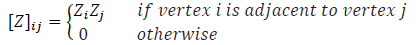
| Hosoya matrix | It is a sparse symmetric square V × V matrix (denoted by Z) derived in the similar manner of W whose elements for a tree are defined as:
Zi and Zj-Hosoya Z-indices of the two sub-graphs after an edge e(i,j) is removed from the acyclic graph. |
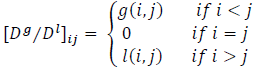
| Distance/Distance | The distance/distance matrix (denoted by D/D) unify the topological and topographic (geometric) information on the structure of a graph. It is an asymmetric V × V matrix in which the topographic information-g(i,j) is represented in upper–triangle matrix and graph-theoretical distance-l(i,j) (topological distance) on the lower-triangle matrix.
|
Table 1. A set of matrices used in chemical graph theory.
Table 1 represents various forms of matrices that are used in chemical graph theory. Generally molecular descriptors obtained from the above mentioned matrices are unique. So structural comparison between chemical molecules is done by comparing the indexes or signatures that are generated from these matrices, which belongs to a subset of exact graph matching problem.
From the computational study of Janezic et al., it is inferred that the classical exact graph matching algorithms employ the concepts of GI and sub-graph isomorphism which requires a bijective node mapping between two (sub) graphs which are computationally expensive (exponential time) as there is a possibility of having O(2n) subgraphs for every graph of ‘n’ vertices. In agreement with that as of now, no efficient algorithm has been found to determine if two general graphs are isomorphic topologically. There are special cases of graphs like triconnected planar graphs, planar graphs, interval graphs, and trees for which GI can be solved in polynomial time. Theoretical proof of Babai, shows that there may exist quasi-polynomial time algorithms that solve GI problem. Mostly chemical graphs may not meet these special cases and therefore we cannot use those algorithms.
In computational chemistry, for dealing with molecular graphs some randomized frameworks have been proposed. In general, randomized techniques are used for fast computation and to enhance simplicity. From the previous literatures, it is observed that randomized algorithms, in some cases, leads to poor accuracy and are closely related to probabilistic analyses of the corresponding (deterministic) computational procedures. Moreover, probabilistic analyses have been used to explain the phenomenon of difficult problems (e.g., NP-hard problems). Some existing frameworks of random graphs that model chemical graphs can be found in the literatures [1]. There is a significant body of work done to representing chemical graphs as linear text strings (canonical label) and computing the structural similarity between two chemical graphs [2]. In line with literatures it is evident that for each chemical molecular graph, if a unique canonical labelling can be computed, then it would imply that efficient polynomial-time algorithms exists for GI problem. From the experimental study of Luks, it is observed for some special cases of chemical graphs, canonical labelling is well suited for solving GI problem, but may fail in some cases (Miyazaki graphs, for example) [3]. A polynomial time algorithm is proposed by Furer et al., for bounded valence graph having computational complexity as O(n τ(d))ii.
J.L Faulon et al., prescribed algorithms that generate unique signatures for molecules and use them as molecular descriptors for comparisons. To solve GI problem, experimental study are conducted by taking alternate ideas like representing graphs as distance matrices (based on their vertex distance from one another) and computing graph similarity by using distance metrics. Klein and DJ Randic, proposed a method that represents a graph as a resistance distance matrix. The distance between vertices in a resistance matrix is measured by electric resistance by assuming each edge carrying a unit resistance. Computational studies based on resistance matrix show that resistance matrix is more a meaningful representation [4-9]. A subset of matrices of Table 1 (say path matrices) introduced in represents the number of sub-graphs of each graph [10]. From the empirical investigation of Plavsic et al., it has been showed that Weiner index and P’/P index obtained from path matrix correlated with the graph-theoretical invariants of cycles and trees.
Graph invariants as numerical representations
Graph invariants embeds the structural properties of Graphs. Among them, the vertex connectivity index known as Randic connectivity index and Hosoya index are often used in the structure-property-activity modelling: the RandiÃ? connectivity indexiii [11]. The Hosoya index is used mostly for graphical matrices along with other molecular descriptors. de Piero et al., proposed a node-to-node mapping which is based on the powers of graph adjacency matrix [12]. Computational studies conducted by Randic et al., on molecular indexing considered a variation of distance matrix known as line distance matrix which is determined by information given in their first row. As Wiener index (molecular descriptor) is defined generally for acyclic graphs, a few categories of methods are evolved by constructing matrices like Szeged and revised-Szeged by generalizing Wiener index to consider polycyclic structures.
Based on the findings, Gutman et al., noticed that the Szeged index does not give good regression as it does not properly reflect molecular size dependence. From the experimental study of Klein et al., it is observed that both Szeged and revised Szeged indexes give a measure of how much a graph depart from the bipartite graph. Among various topological indexes (connectivity indexes) of graphs which characterize their topologies, Balaban J index, can be considered as one of the highly discriminative molecular indexes which is simple to compute. From the critical literature review and motivated by the above studies, it is observed that the availability of finding similarity between graph that supports GI problem is quite scarce. Hence this problem has been considered for computational study. The objective of our work is to generate a unique signature for a given graph. Using this signature, a topological molecular index is computed by which similarity between graphs is presented as a quantized value.
Proposed work
For an adjacency matrix AG of a graph G, solving the Eigen value problem AGx-λx=0 is equivalent to identifying the set of vectors, which is used as the coordinate basis for producing the diagonal matrix of AG. Here, X is considered as unknown Eigen vectors and λ are the eigenvalues of AG which is referred as the graph spectra. This framework is similar to HMO model of quantum chemistry. Thus, AG can be interpreted as a set of vectors which represents graph in the |V|-dimensional space, ‘|V|’ being the total number of vertices of G. In order to describe the distance between vertices of G in the |V|-dimensional space, an attempt is made to propose a new measure of distance in this work. In general, a graph G having |V| vertices can be represented by |V| points in |V|-dimensional space and will result in symmetric |V|×|V| distance matrix. A new matrix (say Inverse Euclidean matrix) is proposed in which each and every row of the matrix represents the inverse of distance from one vertex to all the other vertices of G. So the new Inverse Euclidean matrix (IE) can be constructed by having
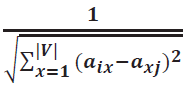
in the (i, j) entry of IE matrix. Here the inverse of the distance is taken so as to find the similarity. When the distance is large, the similarity lessens and vice-versa.
similarity. When the distance is large, the similarity lessens and vice-versa.
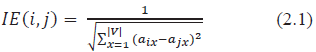
Let the sum of the ith row of IE matrix be denoted as:
It represents the inverse of the total distance from the ith vertex to all the other vertices of G. In this work, an attempt is made to describe a new molecular atomic descriptor based on matrix row (or) column sums of the obtained IE matrix. These descriptors may be used to describe the local atomic environments in a molecule. As these descriptors reveal the local molecular structural properties they can be used in identifying the active substructure in molecular mining and Pharmacophore. Hence these molecular descriptors act like unique graph signatures for an individual molecule. Hence the signature of G can be represented as a |V| × 1 column vector as shown below:

Here * denotes the set of all vertices taken for consideration. When two graphs G1 and G2 are isomorphic, the corresponding points in |V|-dimensional space will coincide, resulting in same signatures S*G1with S*G2 values shuffled. A set of vertices of G1 and G2 share a same value, if and only if they are node-surjective i.e., every vertex νβ∈G2 has at least one matching να∈G2. It is inferred that any formulated distance function d(x,y) in a metric space should have the following three properties:
• d(x,y)=d(y,x)>0 if x not equal to y-distance is non-negative and does not depend on direction in which it is measured.
• d(x,y)=0 if x=y-distance is zero only if x=y.
• d(x,y)+d(y,z) >=d(x,z)-triangle inequality.
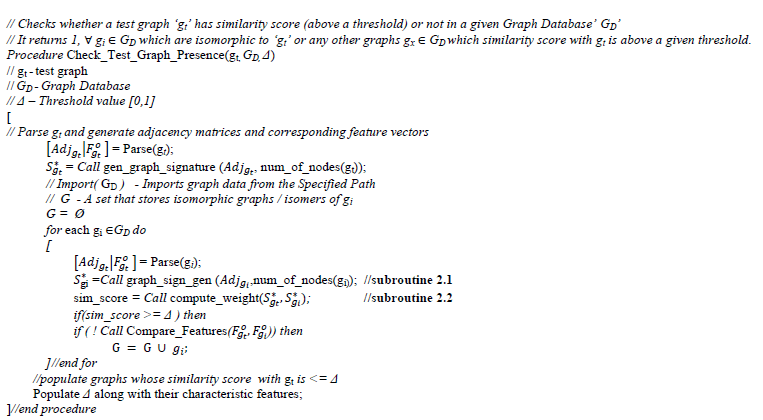
Above three conditions have to be satisfied as the obtained IE matrix has considered the inverse of Euclidean distance between any two vertices. The first condition is satisfied as the IE matrix is a Symmetric Positive Semidefinite Matrix (PSD). All the diagonal elements of IE matrix are zeros as d(x,x)=0 and hence satisfying the second condition. A few pair of vertices may share common neighbours resulting in some off-diagonal elements as zeros. Such pairs of vertices are termed as “Pseudo-Similar” vertices and our IE matrix does contain Pseudo-Similar vertices (Figure 1).

Figure 1: Topological structure of 3-Methylhexane.
In Figure 2, the IE matrix and the natural distance matrix of 3-methylhexane graph (Figure 1), obtained based upon Eq. (2.1) are shown. This chemical molecule is shown because as its one of the smallest trees with trivial automorphism group. The isomers of this molecule are represented and discussed in the below sections (Figure 3).

Figure 2: IE Matrix of 3-Methyl-hexane (left); the std. distance matrix (D)-distance entries for adjacent vertices (right).

Figure 3: Isomers of n-heptane
Devillers and Balaban, suggested to ignore hydrogen atoms in the computation of such indices as organic chemists usually do when they write a benzene ring as a hexagon.
IEGPr and ARSG
In Table 2, the inverse of the row sum for the novel IE matrices of isomers of heptane (illustrated in Figure 3), is shown. They act like unique signatures (SG* ) (by Equation. 2.2 and 2.3) for the specified heptane-isomers. In order to provide a quantized value for any graph, a unique individual score (called as ARS score) is generated for each graph. The Average Row Sum (ARS) score of any SG* is generated by the below formula:

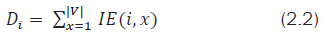
Moreover, it can also be observed that the (i,j) entry of IE matrix (calculated based upon Eq. 2.1) is same as that of
with deg(νi), deg(νj) as degrees of vertices i and j respectively and adj(νi,νj) as the number of vertices adjacent to both i and j. Along with ARSG, a new quantized value known as IEGPr index is computed which may serve as a unique graph (molecular) topological index. This IEGPr index computed based upon Equation. (2.6) is simple, scalable and can be used to compare two graphs directly
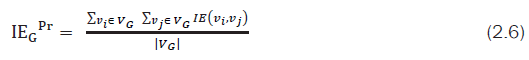
From the experimental study (Ref. Section 3), it is found that IEGPr index value is more or less same as that of λ1 and takes less computational time. It is also observed that both IEGPr and ARSG scores are proportional to λ1. These two quantized values (IEGPr and ARSG) may act as molecular descriptors for any graph ‘G’.
Quantizing the similarity between graphs based on IEGPr and ARSG
In our graph comparison approach, affine invariance property plays a vital role in comparing graphs. When Graphs are represented in matrix forms, approaches like Affine Invariant Riemannian Metric (AIRM) and Log-Euclidean Riemannian Metric (LERM) may be taken for consideration as both the measures induce a Riemannian geometry; the former induces a curved geometry when the latter “flattens” the manifold by mapping into the tangent space at the identity matrix (which is Euclidean). Arsigny et al., formulated LERM metric which involves in taking logarithm for a matrixiv (covariance matrix) that represents a graph. In our case, IEGPr and ARSG are single values which act like topological indexes of any graph G, the LERM metric is reframed to find the similarity score. Putting it altogether, the similarity score between two graphs is quantified as
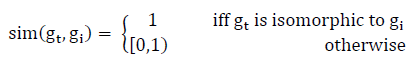
The similarity between two graphs G1 and G2 can be defined as
Here | × | denotes the absolute value of x, it is observed that the row sum of the Euclidean distance matrix for the considered n-heptane isomers along with its Average Row Sum (ARS) are tabulated in the Tables 2 and 3.
| Isomers of heptane | 1 | 2 | 3 | 4 | 5 | 6 | 7 | ARS based on euclidean dist. matrix |
|---|---|---|---|---|---|---|---|---|
| H | 9.3424 | 10.8783 | 10.1463 | 10.2925 | 10.1463 | 10.8783 | 9.3424 | 10.1466 |
| 2-M M2-322-M | 7.8783 | 12.2042 | 9.3823 | 10.1962 | 10.8464 | 9.2925 | 7.8783 | 9.6683 |
| 3-M | 9.4388 | 10.1144 | 11.6184 | 9.3823 | 10.9282 | 9.2925 | 8.5605 | 9.905 |
| 2,3-M | 7.9747 | 11.5958 | 10.9282 | 10.1643 | 9.3889 | 7.9747 | 8.6569 | 9.5262 |
| 2,4-M | 7.8284 | 12.2361 | 8.4721 | 12.2361 | 7.8284 | 7.8284 | 7.8284 | 9.1797 |
| 3,3-M | 9.4388 | 9.3278 | 12.8352 | 9.3278 | 9.4388 | 7.0645 | 7.0645 | 9.2139 |
| 2,2,3-M | 6.4787 | 12.8181 | 10.8884 | 7.9747 | 6.4787 | 6.4787 | 7.9747 | 8.4417 |
Table 2. Row sum of the euclidean distance matrix.
H: n-Heptane, 2-M: 2-Methyl Hexane, 3-M: 3-Methyl Hexane , 3-E: 3-Ethyl Pentane, 2,3-M: 2,3-Dimethyl Pentane, 2,4-M: 2,4-Dimethyl Pentane, 3,3-M: 3,3-Dimethyl Pentane and 2,2,3-M: 2,2,3-Trimethyl Butane
| Signatures (S*G) for isomers of n-heptane | |||||||
|---|---|---|---|---|---|---|---|
| Heptane and its isomers | 1 | 2 | 3 | 4 | 5 | 6 | 7 |
| 2,4-M | 3.4141 | 2.9472 | 4.8947 | 2.9472 | 3.4141 | 3.4141 | 3.4141 |
| 3,3-M | 3.8535 | 4.2698 | 2.8653 | 4.2698 | 3.8535 | 3.8535 | 3.8535 |
| 3-M | 3.8535 | 3.8095 | 3.1786 | 4.2319 | 3.309 | 4.0683 | 4.4923 |
| 2,3-M | 3.1989 | 3.1928 | 3.477 | 3.7565 | 3.9062 | 3.1989 | 4.329 |
| 2-M | 3.3613 | 2.9717 | 4.2319 | 3.7327 | 3.3863 | 4.0683 | 3.3613 |
| 3-E | 3.8535 | 3.5932 | 3.4626 | 3.5932 | 3.8535 | 3.5932 | 3.8535 |
| 2,2,3-M | 3.1987 | 3.4993 | 2.8743 | 2.5685 | 2.5685 | 2.5685 | 3.1987 |
Table 3. The row sums for the novel IE matrices of n-heptane isomers.
From Table 2, it is observed that 2-Methyl hexane is comparatively more similar to 3-methyl hexane, heptane and 2-4 dimethyl pentane. This is due to the fact that the 2nd vertex of 2-methyl hexane is having more topological stress (defined below) similar to 2nd and 3rd vertices of 3-methyl hexane and 2nd and 4th vertices of 2,4-dimethyl pentane. Similarly, for 2,4-dimethyl pentane the 2nd and 4th vertices have topological stress as that of 3rd vertex of both 3-ethyl pentane and 3,3-dimethyl pentane. It is evident from the tabulated result that as the ith vertex (Vi) row sum increases the topological stress for Vi also increases.
From Table 3 specified above, it is inferred that the 2nd vertex value of 2-methyl hexane is as lower as that of the 3rd vertex of 3-methyl hexane and 2nd and 4th vertices of 2,4-dimethyl pentane which in turn leads to high similarity scores between them. Similarly, the 2nd and 4th vertices of 2,4-dimethyl pentane have lesser values same that of the 3rd vertex of both 3-ethyl pentane and 3-methyl hexane which in turn leads to high similarity scores between them which is discussed later. It leads to the fact that as the topological stress increases, it gives lower signature value. These similarity scores implicit convey that there exist one or more common subgraphs with in these graphs such that they are isomorphic.
Graph signatures generating algorithms
Algorithm 1 along with its subroutines 2.1, 2.2 and 2.3 are deployed in C language and Matlab R2011 in a core i3 processor with 4GB internal memory. The parse() function mentioned in Algorithm 1 is deployed in python 2.7.13 to parse gxl files. For experimental study, along with heptane isomer graphs, a portion of benchmark dataset is taken from IAM Graph database.
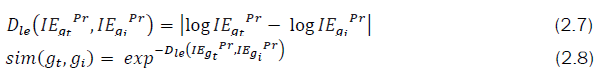
Algorithm 1: Graphs similarity score calculation
Assuming that all graphs are stored in a Graph database (GD), algorithm 1 computes similarity score between any two graphs. For a given test graph ‘gt’, it scans a graph database GD and identifies a set of graphs gi∈GD whose similarity score is equal to or above a particular threshold value. The parse(gi) function of algorithm 1, parses the given graph and generates its corresponding adjacency matrix and an ’o’ sized vector which reveals the gi features. The subroutine 2.1 generates a unique signature for the given graph. The subroutine 2.2 computes the similarity score between given graphs. If the score is greater than a particular threshold it is appended in a set ‘G’. The auxiliary function compare_features()vi compares two feature vectors of any two graphs and can be solved in polynomial time. As this paper focus more on the topological structures of graphs, the feature comparison task is not discussed in detail.
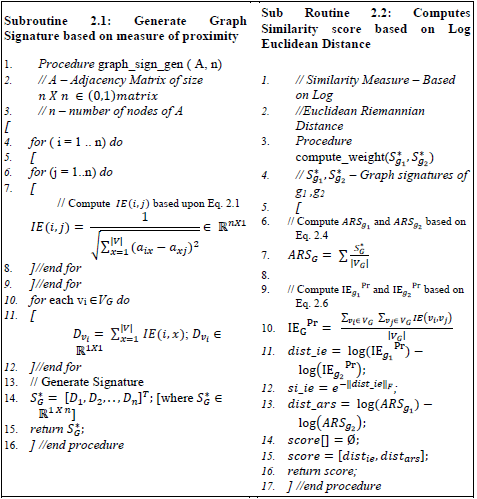
The subroutine 2.1 generates signature based on the equations 2.1 and 2.2 with time complexity as O(n2), n being the number of vertices of a graph. It can be proved S*G as graph invariant. The molecular indexes created from the signature is used to find the similarity score. The execution time, computational complexity and inferences are discussed in the following sub sections. The subroutine 2.2 compute the similarity score based on both IEGPr and ARSG. The computational complexity of this subroutine is O(1). So the total time taken to identify the similarity score between graphs is O(n2). Depending upon graph database (GD) size the computational time increases yielding O(|GD|.n2) where n being the maximum number of vertices present in a large graph gi∈GD.
It is also necessary to identify a subgraph within two graphs which are isomorphic. Let us consider Si be a subgraph of Gi. We are interested in finding out S1, S2 subgraphs of G1 and G2 respectively such that S1 and S2 are isomorphic. Initially, it is necessary to find out a vertex say v1∈ S1 that maps to v2∈S2 (one-to-one correspondence). This process is repeated until all the vertices of S1 uniquely map to all the vertices of S2. To map a set of vertices between two graphs a new term is introduced known as “Topological Stress” (TS). The topological stress of each vertex is defined as
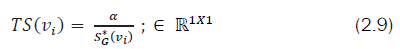
Where,
TS(νi) - Topological stress pertaining to vertex of a graph G.
S*G(νi) - Signature value at the component of G (i.e.Dνi )
α∈â?Â1×1, an arbitrary weightvi between [0,1].
So based upon the topological stress values, a vertex, vi∈G1 can be mapped to vj of G2 by which a permutation matrix can be framed in linear time- O(n) [49] for GI problem. It is also observed that similar topological stressed vertices shows similarity not only in their structure but also in their properties (Ref. subsection 3.1). Below is an algorithm that finds one or more matching vertices of any graph for the give vi ∈Gi that exhibit similar topological stress values between different graphs.
Sub routine 2.3: Identifying similar vertices between graph signatures
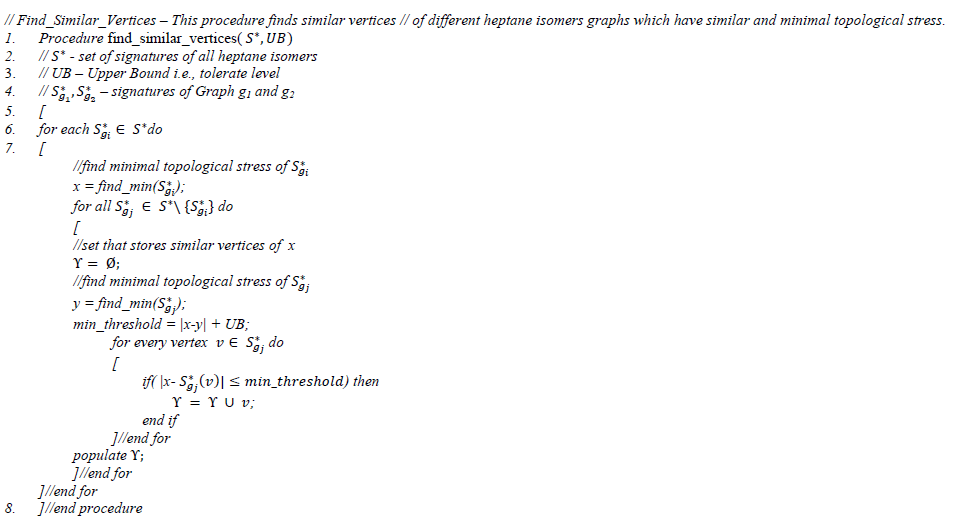
Subroutine 2.3 populates a set of pairs of vertices of different graphs that have more topological stress (i.e., low score in their corresponding signatures). The time complexity of this subroutine is
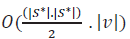
where |S*| the total number of signatures taken for consideration. In this computational study, |S*| value is number of heptane isomers and |v| is 7.
Table 4 shows the ratio of topological stresses of each and every vertex against their high topological stress vertices for each and every heptane isomers. These stress values are not influenced by the degree of the graph. Instead, it is highly influenced by the degree of topological variation of each vertex with others, in the sense, how far one vertex is topologically varied with the other vertex.
| Heptane isomers | Ratio of topological stress among various vertices | ||||||
|---|---|---|---|---|---|---|---|
| 1 | 2 | 3 | 4 | 5 | 6 | 7 | |
| 2-M | 1.1311 | 1 | 1.4241 | 1.2561 | 1.1395 | 1.369 | 1.1311 |
| 3-E | 1.1129 | 1.0377 | 1 | 1.0377 | 1.1129 | 1.0377 | 1.1129 |
| 3-M | 1.2123 | 1.1985 | 1 | 1.3314 | 1.041 | 1.2799 | 1.4133 |
| 2,3-M | 1.0019 | 1 | 1.089 | 1.1766 | 1.2234 | 1.0019 | 1.3559 |
| 2,4-M | 1.1584 | 1 | 1.6608 | 1 | 1.1584 | 1.1584 | 1.1584 |
| 2,2,3-M | 1.2454 | 1.3624 | 1.1191 | 1 | 1 | 1 | 1.2454 |
| H | 1.1948 | 1 | 1.1261 | 1.0617 | 1.1261 | 1 | 1.1948 |
Table 4. Ratio of topological stresses among various vertices of heptane isomers.
From Table 4, the high topological stressed vertices have value 1 whereas other have value greater than 1. For example, in case of 2-Methylhexane, as vertex 2 is highly stressed its value becomes 1, whereas for vertex 3, the value is 1.4241 giving an inference that vertex 3 is approximately 40% less stressed than vertex 2 for 2-Methyl hexane meaning they have 60% common neighbourhood.
Figure 4, shows the plotting of dominating Eigen values ( λ1) obtained from IE matrices of n-heptane isomers against ARSs. The observation here is λ1 is directly proportional to ARS score of the corresponding S*G.

Figure 4: Plotting of λ1 against the ARS scores of n-heptane isomers.
From this it can be inferred that ARS score of S*G are more close to λ1 and hence it exhibits some statistical significance and fine tuning this metric may serve as a simple structural interpretation. Also ARS score is proportional to the average signature vector elements. Moreover, IEGPr score is also same as that of λ1 (Table 5). Besides using λ1 as a molecular descriptor (in some cases), from this empirical study, it is suggested to use the two descriptors defined by IE matrix namely ARS and IEGPr (listed for the isomers of heptane in column 1 and 4 of Table 3) can be used. It is also shown by Hoyasa index, the sum of the matrix elements above the main diagonal of the standard distance matrix D is termed as the Wiener number. This leads to suggest ARS and/or IEGPr score(s) can be used as a supportive substitute for the generalized Wiener number for heptane isomers as they are close in magnitude with Computational Studies are carried out for other isomers viz., octane and nonane which shows satisfactory results.
| n-heptane isomers | ARSG score | λ1 | Balaban’s J index | IEGPr |
|---|---|---|---|---|
| 2,2,3-M | 2.9252 | 2.9526 | 3.5412 | 3.7669 |
| 2,4-M | 3.4922 | 3.5823 | 2.9532 | 3.6993 |
| 3,3-M | 3.8313 | 3.8793 | 3.3606 | 3.7441 |
| 3-M | 3.849 | 3.896 | 2.832 | 3.6936 |
| 2,3-M | 3.5799 | 3.6168 | 3.1542 | 3.7399 |
| 2-M | 3.5879 | 3.6266 | 2.6783 | 3.6716 |
| 3-E | 3.6861 | 3.6914 | 2.9922 | 3.7107 |
| H | 3.699 | 3.7155 | 2.4474 | 3.6473 |
Table 5. λ1 of IE matrices for n-heptane isomers graphs along with IEGPr and ARSG are listed out.
Table 5 tabulates λ1 for n-heptane isomers graphs along with IEGPr and ARSG. From the literature it can be inferred Eigen values of a graph characterize graph’s topological structure and the collection of all eigenvalues of G is denoted as the graph spectravii (spectrum of G). Among various topological indexes which serves as the molecular descriptors of molecules (connectivity indexes), Balaban’s J index is taken for consideration as it is one of the highly discriminative molecular index [13]. The third column shows Balaban’s J indexes which is based on the row sums of the standard distance matrix D. It can be noticed that IEGPr has a value equal to λ1 and is somewhat very nearer to Balaban’s J index. Moreover, the computational time for calculating the circuit rank of any graph G in Balaban’s index is high as it is necessary to find all connected components in G taking the O(V+E) time complexity.
Using the Equation (2.8), the similarity score calculated based on IEGPr and ARSG indexes of various isomers of heptane are tabulated in Tables 6 and 7.
| Isomers | 2- M | 3-E | 3-M | 2,3-M | 2,4-M | 3,3-M | 2,2,3-M | H |
|---|---|---|---|---|---|---|---|---|
| 2-M | 1 | 0.9895 | 0.994 | 0.9817 | 0.9925 | 0.9806 | 0.9747 | 0.9934 |
| 3-E | 0.9895 | 1 | 0.9954 | 0.9922 | 0.9969 | 0.9911 | 0.9851 | 0.9829 |
| 3-M | 0.994 | 0.9954 | 1 | 0.9876 | 0.9985 | 0.9865 | 0.9805 | 0.9875 |
| 2,3-M | 0.9817 | 0.9922 | 0.9876 | 1 | 0.9891 | 0.9989 | 0.9928 | 0.9752 |
| 2,4-M | 0.9925 | 0.9969 | 0.9985 | 0.9891 | 1 | 0.988 | 0.9821 | 0.9859 |
| 3,3-M | 0.9806 | 0.9911 | 0.9865 | 0.9989 | 0.988 | 1 | 0.9939 | 0.9741 |
| 2,2,3-M | 0.9747 | 0.9851 | 0.9805 | 0.9928 | 0.9821 | 0.9939 | 1 | 0.9682 |
| H | 0.9934 | 0.9829 | 0.9875 | 0.9752 | 0.9859 | 0.9741 | 0.9682 | 1 |
Table 7. Similarity score between graphs based on IEGPr.
| Isomers | 2-M | 3-E | 3-M | 2,3-M | 2,4-M | 3,3-M | 2,2,3-M | H |
|---|---|---|---|---|---|---|---|---|
| 2-M | 1 | 0.9621 | 0.9327 | 0.9989 | 0.9622 | 0.938 | 0.8145 | 0.9621 |
| 3-E | 0.9621 | 1 | 0.9695 | 0.9611 | 0.9257 | 0.975 | 0.7837 | 1 |
| 3-M | 0.9327 | 0.9695 | 1 | 0.9317 | 0.8974 | 0.9943 | 0.7597 | 0.9695 |
| 2,3-M | 0.9989 | 0.9611 | 0.9317 | 1 | 0.9632 | 0.937 | 0.8154 | 0.9611 |
| 2,4-M | 0.9622 | 0.9257 | 0.8974 | 0.9632 | 1 | 0.9026 | 0.8466 | 0.9257 |
| 3,3-M | 0.938 | 0.975 | 0.9943 | 0.937 | 0.9026 | 1 | 0.7641 | 0.975 |
| 2,2,3-M | 0.8145 | 0.7837 | 0.7597 | 0.8154 | 0.8466 | 0.7641 | 1 | 0.7837 |
| H | 0.9621 | 1 | 0.9695 | 0.9611 | 0.9257 | 0.975 | 0.7837 | 1 |
Table 8. Similarity score between graphs based on ARSG.
From Table 8, it is observed that the similarity scores based on IEGPr of 2-methylhexane, 3-methylhexane is 0.9940 with the second largest score of between 2-methyl hexane and 3-ethylpentane 0.9895; Similarly, the score between 2,3-dimethyl and 2,4-dimethylpentane is 0.9755, highest among the scores when 2,4-dimethylpentane is compared with other isomers [14,15]. It is evident from the above results that the IEGPr score increases when two molecules have similar skeletal structures. Moreover, similar results referred in Table 7 show that the ARS similarity score results are less accurate compared to score IEGPr results.
Topological stress in interconversion of methylalkanes
From the experimental study of Maury et al., it is inferred that the interconversion of methylalkanes like 3-methylhexane and 2-methylhexane can be done using sulfuric and chlorosulfonic acids (Figure 5).

Figure 5: Methylalkanes interconversion reactions.
At -33.4°C, the proportion of 2-methylhexane and 3-methylhexane are 65.5% and 34.5% respectively. From the signatures of the isomers (refer Table.4) the topological stresses of 2nd vertex of 2-methylhexane and 3rd vertex of 3-methylhexane are comparatively higher than other vertices, thus leading low values 2.9717 and 3.1786 respectively. Similarly, by analysing the signature of 2,4-dimethyl pentane, the 2nd and 4th vertices have more topological stresses yielding low values of 2.9472 and 2.9472 respectively. Also the signature of 2,3-dimethylpentane shows more topological stresses in 2nd vertex (3.1928) and the 3rd vertex (3.4770). It can be noted, at -33.4°C, the proportions of 2,4 and 2,3-dimethyl pentanes are 72.9% and 27.1%. In case of both the interconversion reactions of 2-methylhexane/3-methylhexane and 2,4-dimethylpentane/2,3-dimethylpentane possessing secondary carbon atoms with similar environment. By using these molecular descriptors, we can differentiate each atomic environment which is the usefulness of subgraph mapping. It is observed that the percentage of conversion is correlated with λ1 obtained from the IE matrix. If λ1 score is less, the conversion percentage is high and vice-versa. For example, in our studies, it confirms that the interconversion reaction between 2-methylhexane and 3-methylhexane gives Eigen value 3.6266 and 3.8960 respectively. So it can be inferred that the signatures of graphs not only act like molecular descriptors but also embed topological structures along with the change of chain branching that occur during interconversion reaction of methylalkanes reversible processes which will open up new gate way for further investigations.
Impact of signatures in complete graphs
The graph isomorphism can be solved efficiently for almost all graphs having problems only when considering special family of graphs of bounded degree. Besides this, most algorithms of GI have significant problems with the graphs originated from projective planes. The good candidates belong to this family are strongly regular graphs. In this section, applying our method we try to distinguish a few special types of hard graphs by showing some variation in S*G and IEGPr score.
Table 8 tabulates signatures of complete graphs (k|v|) with |V| vertices. Here all the vertices of all graphs are dominating vertices. It is inferred from the generated signatures that, though, for example, K4 and K5 have dominant vertices, their topological stress values are different. From this, it is evident that two complete graphs never map to the same signatures which is one of the major hurdles in graph isomorphism checking. This signature generation is the first representation of its kind, to the best of our knowledge [16].
| K|v| | Signature | IEGPr | ARS | |||||||||
|---|---|---|---|---|---|---|---|---|---|---|---|---|
| K3 | 0.7071 | 0.7071 | 0.7071 | - | - | - | - | - | - | - | 1.3027 | 0.7071 |
| K4 | 0.4714 | 0.4714 | 0.4714 | 0.4714 | - | - | - | - | - | - | 1.394 | 0.4714 |
| K5 | 0.3536 | 0.3536 | 0.3536 | 0.3536 | 0.3536 | - | - | - | - | - | 1.4947 | 0.3536 |
| K6 | 0.2828 | 0.2828 | 0.2828 | 0.2828 | 0.2828 | 0.2828 | - | - | - | - | 1.5945 | 0.2828 |
| K7 | 0.2357 | 0.2357 | 0.2357 | 0.2357 | 0.2357 | 0.2357 | 0.2357 | - | - | - | 1.6909 | 0.2357 |
| K8 | 0.202 | 0.202 | 0.202 | 0.202 | 0.202 | 0.202 | 0.202 | 0.202 | - | - | 1.7835 | 0.202 |
| K9 | 0.1768 | 0.1768 | 0.1768 | 0.1768 | 0.1768 | 0.1768 | 0.1768 | 0.1768 | 0.1768 | - | 1.8722 | 0.1768 |
| K10 | 0.1571 | 0.1571 | 0.1571 | 0.1571 | 0.1571 | 0.1571 | 0.1571 | 0.1571 | 0.1571 | 0.1571 | 1.9575 | 0.1571 |
Table 8. Complete graphs signatures.
IEGPr and ARSG scores for large graphs
From the above Figure 4, it can be seen that the IEGPr index value and λ1 score are relatively equal except for 2,2,3-trimethyl-butane. Moreover, the computational complexity of λ1 is O(|V|3) whereas for IEGPr can be calculated in O(|V|2)) time. Figures 6 and 7, depicts the plotting of ARS scores of large graphs (sizes varying between 60 and 100) against λ1. It is observed that as |V| of graph increases the ARS score also increases [17].

Figure 6: Comparison of λ1, IEGPr index and the Balaban J index of n-heptane isomers.

Figure 7: Plotting of ARS Score against λ1 for large graphs (|V| ranging between 60 to 100).
From Figure 8, it is evident that, the execution time taken to compute leading Eigen values increase with increase in graph size and, whereas the IEGPr computational time increases very slowly irrespective of graph size and comparatively lower than the other two. Moreover the computational time of finding λ1 is O(|V|3) whereas ARS’s computational complexity is O(|V|2) which is evident from this empirical study.

Figure 8: Time taken for computing λ1, ARS and IEGPr for large graphs.
Figure 9 depicts the time taken to generate signatures for large graphs. It is observed that as the |V| size increases, the time taken also increases but in few milliseconds. This execution time can further be reduced by optimizing the working code. These promising results in execution time calculation give inference in applying these graph signatures in large graph databases mining [18].

Figure 9: Computation time taken for large graph signature generation.
Figure 10 depicts the variations in average similarity score of large random graphs ranging 70 ≤ |V| ≤ 100. It is observed that as number of edges removed is more, the similarity score between graphs lessen. Also there are some peaks observed. This may be due to the fact that there are some highly influential edges which may act as bridges between two or more connected components [19]. By removing those edges, the similarity value decreases drastically which leads to an assumption that the edges are also topologically stressed and finding highly stressed edges from signatures (and/or other meaningful representations) opens new direction of research study that are more useful in network analysis [20].

Figure 10: Variation in avg. similarity score based on removal of edges of large graphs.
In this work, graphs are represented as objects in n-dimensional space. Based on the distance between vertices, a new distance matrix, which is referred as IE matrix is constructed. This matrix is framed by considering the inverse of the distance between every pair of vertices in the graph as the distance between vertices is large, the similarity between them lessens and vice-versa. This representation directly represents the internal fixed geometry of the vertices of graphs in the n-dimensional space. In this space, if two vertices are near, then they are very similar. Based on this matrix, new topological index values (IEGPr and ARS) are generated for every graph. It is observed from the empirical study that among these values, IEGPr is more meaningful and may be used as index values of molecules in computational chemistry. Moreover, based on IEGPr, attempts are made to tackle GI problem. Empirical study shows that finding IEGPr and identifying similarity score between graphs are simple and scalable, in the sense, they can be computed in linear time in number of edges. The obtained IEGPr is compared with a state-of-the-art topological index which shows some improvisation in running time and accuracy. Experimental evaluations demonstrate the computational time taken to calculate IEGPr for large graphs is very minimal (in msec) which provides a right balance between computational tractability and expressiveness of graph representation. Also, from signatures, attempts are made to identify topologically highly stressed vertices of graphs. It is observed that signatures embed topological structures along with the change of chain branching that occur during many chemical processes, like interconversion reaction of methylalkanes and the percentage of conversion is highly correlated with λ1. Reliant on this IEGPr index and the similarity score, it is recommended to imbibe other factors like bond angles between atoms, molecular density, and columnar mass density to give more expressiveness to molecular graphs by which more inferences about any chemical molecule can be made and tackling GI problem in polynomial time.