Research & Reviews: Journal of Pure and Applied Physics
ISSN: 2320-2459
ISSN: 2320-2459
1Department of Chemical and Petroleum Engineering, Faculty of Engineering, UCSI University Kuala Lumpur-56000, Malaysia
2Department of Chemical Engineering, School of Engineering and Science, Curtin University of Technology, 98009 Sarawak, Malaysia
3Department of Chemical Engineering, University of Nottingham, 43500 Semenyih Selangor Darul Ehsan Malaysia
4Department of Petroleum and Chemical Engineering, Faculty of Engineering, Institute Technology Brunei, Tungku Gadong, P.O. Box 2909, Brunei Darussalam
5Malaysia – Japan International Institute of Technology (MJIIT), University Technology Malaysia, Jalan Semarak, 54100 Kuala Lumpur, Malaysia
6Department of Chemical Engineering, Faculty of Engineering, University of Malaya, 50603 Kuala Lumpur, Malaysia
Received Date: 17/11/2015; Accepted Date: 21/12/2015; Published Date: 15/06/2016
Visit for more related articles at Research & Reviews: Journal of Pure and Applied Physics
The adsorption isotherm and kinetic studies on the removal of Mg2+ metal ion by using rice husk based magnetic bio char have been carried out. The analyses of batch mode experiments were performed to study the experimental parameters of pH, adsorbent dosage, agitation speed and contact time. From the statistical analysis, it was known that the highest removal of Mg2+ is at pH 4, adsorbent dosage of 0.5 g, agitation speed of 150 rpm and a contact time of 180 minutes. The initial concentration of 0.2 mg/l, the removal efficiency of Mg2+ using magnetic rice husk was 95% and the maximum adsorption capacity was 39.52 (mg/g) observed. The adsorption isotherms are well described by both Langmuir and Freundlich models and adsorption kinetic obeyed pseudo-second order.
Magnetic biochar; Magnesium; Heavy metal; Adsorption; Kinetic data
Nowadays, there are major concerns on the water resources based environmental problems that have been facing by all living organisms. Discharging of pollutants into water resources such as river stream or to the sea is known to be a frequent occurrence in polluted sites. These pollutants mainly consists of heavy metals which are well known to be toxic, carcinogenic and may even pose great threat to living organisms with long term and high dose exposure. Heavy metals are basically elements on ground or water resources with an atomic weight of between 63.5 to 200.6 and a specific gravity of more than 5 or density exceeding 5 g per cubic meter [1,2]. Some of the examples of heavy metals are zinc, lead, cadmium, chromium, magnesium, copper and many others. Some of these elements that are in this category are listed more in detail in the Table 1. These metals are important to be removed from water resources as the threat to living organism and public health can be minimized. In order to remove these heavy metals, a suitable treatment process needs to be introduced which can be satisfied in every possible ways, starting from its removal efficiency to its process cost [3]. Some of the common methods where they use to remove heavy metal around the globe are ion exchange, electrolysis, precipitation, membrane separation, solvent extraction, reverse osmosis (RO) and coagulation-flocculation [4-9]. However, these methods have their own advantages and limitations. These processes also demonstrate some significant disadvantages such as that it undergoes removal which are incomplete, toxic sludge production and high energy requirements.
| Heavy Metal | Toxicities | MCL (mg/L) |
|---|---|---|
| Arsenic | Skin manifestations, Visceral cancers, Vascular disease | 0.050 |
| Cadmium | Kidney damage, Renal disorder, human carcinogen | 0.01 |
| Chromium | Headache, diarrhoea, nausea, vomiting, carcinogenic, | 0.05 |
| Copper | Liver damage, Wilson disease, insomnia | 0.25 |
| Nickel | Dermatitis, nausea, chronic asthma, coughing, human carcinogen | 0.20 |
| Zinc | Depression, lethargy, neurological signs and increased thirst | 0.80 |
| Lead | Damage the fetal brain, diseases of the kidneys, circulatory system and nervous system | 0.006 |
| Mercury | Rheumatoid arthritis, diseases of the kidneys, circulatory system and nervous system | 0.00003 |
Table 1. The MCL standards for the most hazardous heavy metals.
The sorption technique is proved to be an attractive and an effective method to remove heavy metals. This is because sorption technique stands out from other techniques by having low operating and maintenance cost, consumes less energy, shorter process time, lesser generation of toxic sludge and most importantly high removal efficiency [10]. Some of the common absorbent used for sorption technique are carbon nanotubes, resin, activated carbon, silica gel and recently, Magnetic Biochar [11]. Activated carbons are widely used in absorption processes because of their high ability, reasonable cost and its effectiveness. However, according to studies, activated carbon is still considered to be a high cost absorbent and it gets more expensive as the quality of the activated carbon increases [10]. Thus, this has led to the search of an alternative adsorbent that is cheap and effective.
Biochar is a biocoal or charcoal which is a porous and fine-grained substance that has the same form of potting soil that is mixed with iron solution which is produced under the influence of maximum temperature conditions and oxygen-limited conditions using organic waste. In recent year, biochar has received big demands as a large scale soil modification to improve crop production, the fertility of soil and as nutrient preservation. Biochar, basically, has a high porosity level and wide-ranging surface area of relatively structured carbon matrix. This proves that biochar can act as an absorbent that has similar aspects of an activated carbon which plays a significant role of controlling the pollutants in the environment [11].
Some of the agricultural wastes or organic wastes derived for biochar as a sorbing organic pollutant are wood or bark, broiler litter, rice husk, pine-wood, corn straw, coconut shell, dairy manure, elephant grass and many more. These agricultural wastes are extensively available as an inexpensive raw material to produce biochar. However, the powdered biochar is proven for being difficult to be separated from an aqueous solution. Therefore, a magnetic medium by chemical co-precipitation is an efficient method for making the sorbent to effectively be separated by magnetic separating technique. Moreover, the joint magnetic medium has the potential of adding the functions of bulk magnetic sorbent [12].
The aim of this study was to produce a cost-effective and high efficiency absorbent to remove the heavy metals. In this study, magnetic biochar is prepared from rice husks to provide a potentially cheap alternative precursor and also to eliminate the waste disposal as well [2]. In this research, the statistical optimization on the removal of Mg2+ from aqueous solution by the usage of Magnetic biochar was carried out. The effect of each process parameter pH, adsorbent dosage, and agitation speed and contact time on the removal of Mg2+ was investigated using Magnetic Biochar. The equilibrium kinetic and isotherm model equation for the removal of Mg2+ was also investigated.
Preparation of Magnetic Biochar
The dried biomass was crushed and sieved to a particle size of less than 150 μm. It was then impregnated at ratios of 0.5 to 1.15 by weight (activating agent/dried biomass), for 4 h at room temperature and dried at 100°C and stored in desiccator. The pyrolysis of biomass was carried out in a HAMiab-C1500 Microwave Muffle System oven. 20 g of prepared sample was placed inside the quartz tube (35 mm OD, 38 mm ID and 500 mm length). The optimum pyrolysis parameters were, power=800 W, irradiation time=30 min and nitrogen gas flow=0.2 ml/min. After the reaction sample was cooled down to room temperature and final weight taken to determine the yield of the product. The product was washed with distilled water until the pH become neutral. Finally the sample was stored in tightly closed bottles.
Preparation of Mg 2+ Stock Solution
Magnesium solution was to be prepared using stock solution from MERCK. Analytical grade is employed to prepare stock solution from a 1000 mg/L of magnesium metal’s ions which further dilute with distilled water using volumetric flask to required concentrations. As for this research, the initial concentration of Mg2+ metal ions was set to 0.20 mg/L and the prepared solution was used for batch adsorption experiments.
Design of Experiment using Design Expert 8.0
The Design Expert 8.0 is basically software designed for optimizing the growth of processes and products. In other words, it was designed to help with the understanding of a multi-factor experiment. In this research, the Design Expert 8.0 was employed to design the batch adsorption experiments by varying the pH, adsorbent dosage, contact time and the agitation speed which are the optimizing conditions. The parameters used for this research are of various variables that consist of dosage of the adsorbent from 0.1 to 0.5 g, pH of the adsorbent from 4 to 8, agitation speed from 120 rpm to 150 rpm and agitation time from 120 minutes to 180 minutes room temperature.
Batch Adsorption Experiment
A batch adsorption experiment was performed by using 125 ml of 2.0 mg/L of Mg2+ agitated with varying dosages of Magnetic Biochar and other variable parameters according to the design obtained from the Design of Expert (DOE). The initial and final concentration of Mg2+ stock was determined using Atomic Spectrometer (PerkinElmer an Analyst 400). Once the agitation process takes place, the process is then continued with filtration before the testing of the final concentration. The design of experiment of various runs with different parameters is shown in Table 2.
| Run | pH | Agitation speed (rpm) | Agitation time (hrs) | Adsorbent dosage (g) |
|---|---|---|---|---|
| 1 | 4 | 120 | 3 | 0.1 |
| 2 | 8 | 150 | 2 | 0.5 |
| 3 | 4 | 150 | 2 | 0.5 |
| 4 | 4 | 120 | 3 | 0.5 |
| 5 | 4 | 150 | 3 | 0.1 |
| 6 | 4 | 120 | 2 | 0.1 |
| 7 | 8 | 120 | 2 | 0.1 |
| 8 | 8 | 120 | 3 | 0.1 |
| 9 | 6 | 135 | 2.5 | 0.3 |
| 10 | 8 | 150 | 3 | 0.5 |
| 11 | 4 | 150 | 2 | 0.1 |
| 12 | 8 | 120 | 2 | 0.5 |
| 13 | 4 | 150 | 3 | 0.5 |
| 14 | 8 | 120 | 3 | 0.5 |
| 15 | 4 | 120 | 2 | 0.5 |
| 16 | 8 | 150 | 3 | 0.1 |
| 17 | 8 | 150 | 2 | 0.1 |
Table 2. Design of experiment using Design Expert software for Magnesium.
The adsorption capacity of magnetic biochar at time t was determined by using this equation (1) while the adsorption equilibrium of Mg2+ was computed based on equation (2)
qt (mg/g)=[(Co–Ct)V]/m (1)
qe (mg/g)=[(Co–Ce)V]/m (2)
where Co represents the initial concentration of Mg2+ solution (mg/L), qt represents the concentration of Mg2+ at time t (mg/g), qe represents the Mg2+ uptake at equilibrium, Ce represents the equilibrium concentration of Mg2+ (mg/L) respectively; V represents the volume of Mg2+ stock solution (L) and m indicates the weight of the adsorbent used (g).
Characterization of Magnetic Biochar
The physical structure and morphology of the Magnetic Biochar had been examined by the Field Emission Scanning Electron Microscope (FESEM) technique. The Fourier Transform Infrared (FTIR) spectroscope was used to study the surface chemistry of Magnetic Biochar. Elemental analysis (carbon, hydrogen, nitrogen, and sulphur values) was studied through using Elemental Analyzer, (Model: TRUSPEC CHNS MICRO). Oxygen content was calculated by the formula, 100–(C%+H%+S%+N%+ash%)
Characterization of FTIR image on Magnetic Biochar
Fourier Transform Infrared (FTIR) spectroscope ((Bruker, IFS66v/S) was used to analyse the magnetic biochar for determination of the surface functional groups. Besides porosity, adsorption behaviour of magnetic biochar is also influenced by the chemical reactivity of the surface especially in the form of chemisorbed oxygen in various forms of functional groups. The surface oxides have acidic as well as basic properties. The magnetic biochar before and after adsorption of heavy metal was successfully investigated using Fourier Transform Infrared spectroscope (FTIR) (Bruker, IFS66v/S). Figure 1 shows the FTIR spectra before adsorption (a) and after adsorption (b). The band located at 3714-341 cm-1 is related to the N-H groups, while the band 2361 is grouped as C≡C stretch of alkynes Vibration of C≡N is ascribed at intensity 1995 cm-1. The transmittance at 1652-1498 cm-1 is similar to the O-H (hydroxyl) group, and CH2 and C-O-C (ether, ester and phenol) functionalities are shown with intensive peaks at 1425 and 1276 cm-1. The transmittance at 1652-1497 cm-1 is similar to the O-H (hydroxyl) group, and absorption peak of 1557 cm-1 recommends the occurrence of aromatic with C-C stretch (ester and phenol) whereas the peak observed at 1071 cm-1 represents the presence of either group. On the other hand, the peak observed at 668 cm-1 reveals alkynes with C-H blends is present. These result good agreement with previous researchers [13,14].

Figure 1: FTIR Spectra on a) magnetic biochar before adsorption and b) magnetic biochar after adsorption.
Characterization of FESEM on Magnetic Biochar
The Field Emission Scanning Electron Microscopy (FESEM) is basically a technique used to capture 3 dimensional images at a high resolution and it was used to observe the surface physical morphology at different magnification scales of the magnetic biochar as shown in Figure 2. Through these images, it was learnt that porosity is created during the chemical activation by N2 gas as the oxidant agent diffusion through the carbon is involved in the impurities removal and consumption of carbon. The micro porosity on the surface favours the opening, which creates large pores on the surface and a porous structure. This causes the well-structure magnetic biochar favours high adsorption capacity for the adsorption of Mg2+ metal ions. The properties of magnetic biochar are shown in the Table 3.

Figure 2: (a-b) FESEM images before adsorption (c-d) FESEM image after adsorption at different magnification scale.
| Properties | Magnetic Biochar |
|---|---|
| Bet surface (m2/g) | 765 |
| Particle size (μm) | <150 |
| Carbon content | 55 |
| pH | 7 |
| Bulk density (g/cm3) | 1.24 |
Table 3. Characterization of Magnetic Biochar.
Statistical analysis for the removal of magnesium, Mg 2+
Batch experiments were conducted using the Design Expert software which is employed to design the batch adsorption experiments by varying the pH, adsorbent dosage, contact time and the agitation speed which are the optimizing conditions. Table 4 illustrates the results from analysis of variance using magnetic biochar as an adsorbent in the removal of Mg2+. The fisher F-test value and the p value which is the lower probability are important values from the analysis for model validation. Normally, the fisher F-test value indicates the mean square of the regressed model to compare the mean square of the residuals of errors while the p value (lower probability) is important to show the higher significance for regression model.
| Source | Sum of Squares | DF | Mean Square | F Value | Prob> F | Status |
|---|---|---|---|---|---|---|
| Model | 1370.86 | 14 | 97.92 | 20.23107 | <0.0001 | significant |
| A | 1036.84 | 1 | 1036.84 | 214.22 | 0.043 | |
| B | 152.52 | 1 | 152.52 | 31.51 | 0.11 | |
| C | 27.56 | 1 | 27.56 | 5.69 | 0.25 | |
| D | 34.2 | 1 | 34.22 | 7.07 | 0.22 | |
| AB | 22.09 | 1 | 22.09 | 4.56 | 0.27 | |
| AC | 9 | 1 | 9 | 1.86 | 0.40 | |
| AD | 11.56 | 1 | 11.56 | 2.38 | 0.36 | |
| Curvature | 2.96 | 1 | 0.0005 | significant | ||
| Pure Error | 0.95 | 9 | ||||
| Cor Total | 1448.375 | 16 |
Table 4. Analysis of variance (ANOVA) for the removal of Mg2+ using Magnetic Biochar.
The model F-test value is significant as the value obtained from the analysis of variance is 20.23. The Curvature Ftest value obtained is 2.97, which implies that the model is significant curvature as measured by the difference between the average of the centre point and the average of the factorial point in the design model. The correlation coefficient value R2adj is 0.9964 whereas the adjusted determination coefficient, R2 is 0.9472, which implies that the model is significant. From the ANOVA obtained, the model designed was significant with the sum of square value of 1370858. The regression model for magnesium residual (mg/L) in terms of coded factors is given by the following equation:
Removal% in coded factors
Removal% ofMg2+=78.59-8.05A+3.09B+1.31C+1.46-1.18AB-0.75AC-0.85AD+0.74BC-0.86BD+0.96CD-0.75ABC- 0.93ACD-0.74
Based on the equations developed from coded factors, a represent for pH, B is the dosage and C is the contact time of adsorbent the single factor coefficient is represents effect on the particular factor while two factor coefficients represent the interaction among the two factors involved. The positive sign in the equation is describes the synergistic effect and negative sign is represent antagonistic effect.
The 3-dimensional plot for the removal of Mg2+ from aqueous solution using Magnetic Biochar is demonstrated in Figure 3(a-c). These plots were done to determine the relationship between the percentage removals of heavy metal Mg2+ ion with the optimizing conditions. The interaction of pH and adsorbent dosage were plotted on Figure 3(a). Based on the plot, the removal of Mg2+ ions are increased as the dosage increase but reduced when the pH increases. In another word removal efficiency is directly proportional to adsorbent dosage and inverse proportional to pH value. Meanwhile pH is also an important parameter as it exhibit high removal at lower pH for the biochar. Figure 3(b) shows the interaction between contact time and pH value. An optimum removal percentage was obtained at a long contact time and a lower pH value. The last analysis was done that denotes the contact time and the adsorbent dosage where the highest removal percentage was obtained at a longer contact time and a high adsorbent dosage. Based on these Figure 3(c), it can be concluded that as the contact time and adsorbent dosage increases, the removal percentage increases as well but at a lower pH value.

Figure 3: A 3-D interaction plot of the removal of Mg2+ using magnetic biochar, (a) Interaction of pH and adsorbent dosage (b) Interaction of contact time and solution pH, (c) Interaction of contact time and adsorbent dosage.
Figure 4 shows the theoretical values versus the experimental values for magnesium residual. These predicted percentage removal values and the actual values were obtained from the Design Expert software. It is clearly shown that the theoretical values obtained were quite close to the experimental values, indicating that the model developed was successful in bridging the correlation between the process variables to magnesium residual. The quality of the model developed was evaluated based on the correlation coefficient value as the correlation coefficient was above 0.95 from the plot. The model equation presented high R2 statistics of 0.9965 showing that 99.65% of the variations in magnesium residual can be explained by the independent variables such as adsorbent dosage, contact time, agitation speed and pH value. The R-value obtained was relatively high, indicating that there was a good agreement between the experimental and the theoretical values from the models. The model also shows that R2 is in reasonable agreement with the adjusted R2 value of 0.9472. According to these criteria, the best model can be identified. The statistical analysis gave several comparative solutions for optimum conditions of best magnesium adsorption by magnetic biochar. The optimum condition selected by the software as the first choice was at an adsorbent dosage of 0.5 g, contact time of 3 hours, agitation speed of 150 rpm and a pH value of 4. These optimum conditions were used for the adsorption isotherms and kinetics study for the determination of particle limiting adsorption capacity (qm) as well as for bench scale model operation.

Figure 4: Relation between the Predicted and Actual value of the removal of Mg2+ using magnetic biochar.
Adsorption kinetic and adsorption isotherm studies
In order to determine the optimize conditions of Mg2+, an analytical study was done on magnetic biochar through kinetics and isotherm studies. As the pH value of 4 showed the highest removal efficiency, it was selected to conduct this kinetic study. The parameters that were kept constant are the adsorbent dosage, volume of solution and agitation speed. An interval of 20 minutes, for the first two hours, the samples were taken to analyse. Then, it was followed by the 3rd hour and the 5th hour and finally at the end of 24 hours was recorded. From the Figure 5, it can be seen that adsorption increases until it reaches 120 minutes. After that, the concentration was constant. This indicated that the magnetic biochar reached equilibrium at 120 minutes. Further increase in the contact time leads to liner trend was observed.

Figure 5: Adsorption capacity (qt) versus contact time at different concentration values.
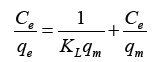
Langmuir and Freundlich equations are important in adsorption isotherm and kinetics studies. Both models were applied in the present research. Langmuir equation is used to relate the solid phase adsorbate concentration (qe) and the equilibrium solution concentration (Ce) of Mg2+ from the batch adsorption as shown in equation (3).
 (3)
(3)
Where Ce (g/L) and qe are the unadsorbed Mg2+ concentration in solution at equilibrium and the amount of adsorbed Mg2+ concentration per unit weight of the adsorbent, KL is the equilibrium constant or Langmuir constant related to affinity of binding sites (L/mg) and qm represents a particle limiting adsorption capacity when the surface is fully covered with Mg2+ and support for the adsorption performance comparison. Kl and qm from the slope and intercept lines of Ce/qe versus Ce graph.
Figure 6 represents the adsorption isotherm for linearized Langmuir model with Magnetic biochar. Based on the plotted graph it can observe that the isotherm data fits for Langmuir equation as it obtained correlative coefficient R2 was 0.9971. The KL and qm values were calculated using the slope and intercept of the graph which then compared to the Langmuir equation described earlier. The KL and qm values for biochar obtained 4.77 L/mg and 39.52 mg/g.

Figure 6: Langmuir Adsorption Isotherm of Mg2+.
The model further analyzed using Freundlich isotherm. The equation for this isotherm was derived into linear form in order to calculate the KF and n value which are the Freundlich constant and constant value which describes the importance of a relationship between the adsorbate and adsorbent. The KF and n values were calculated from slope and intercept of the linear plot of ln qe versus ln Ce. Meanwhile the correlation factor, R2 were obtained 0.998 which shows both models are favourable for Freundlich isotherm. Table 5 shows the calculated values for Langmuir and Freundlich meanwhile Figure 6 and 7 shows the linearized Langmuir and Freundlich models.

Figure 7: Freundlich adsorption isotherm of Mg2+.
| Adsorbent | Langmuir Isotherm | Freundlich Isotherm | ||||
|---|---|---|---|---|---|---|
| qm (mg/g) | KL(L/mg) | R21 | KF (L/mg) | n | R22 | |
| Magnetic Biochar | 39.52 | 4.77 | 0.9971 | 29.92 | 1.311 | 0.9982 |
Table 5: Langmuir and Freundlich constants.
The Langmuir and Freundlich equations were developed in order to relate the unadsorbed metal ions Mg2+ with equilibrium adsorption capacity to the as shown the equations below.
Developed Langmuir equation:
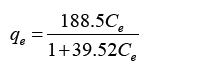 (4)
(4)
Developed Freundlich equation:
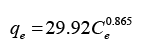 (5)
(5)
There are several kinetic models that are available to study the mechanisms of adsorption process. The two kinetic models that were tested to fit the experimental data were pseudo-first order and the pseudo-second order equation [15,16]. This study was conducted by between magnetic biochar and three different pH values of pH 4, 6.5, and 8. This is said to be a successful kinetics description of the fixation reaction of dyes on the adsorbent. The pseudo-first order equation is given by:
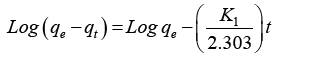 (6)
(6)
Where qe and qt are the adsorption capacity at equilibrium and at time t respectively in mg/g while K1 is the rate constant of pseudo first order adsorption in min-1. From a plot of Log(qe - qt) versus t,qe and K1 can be determined from its slope and intercept.
The pseudo-second order equation is given by:
 (7)
(7)
Where qe and qt are the adsorption capacity at equilibrium and at time t respectively in mg/g while K1 is the rate constant of pseudo first order adsorption in g/mg.h.
The kinetic constants are obtained by linear regression which as shown in Figure 7 for pseudo-second order model and are listed in Table 6. For the pseudo-first-order kinetic model, the graph of Log(qe - qt) versus t was plotted. The plot showed that it did not produce a straight line, thus did not yield in proper convergence. Therefore, this clearly proves that the experiment do not follow the pseudo-first-order kinetic model. Meanwhile for the pseudo-second-order adsorption, the graph of (t/qe) versus time was plotted and all data were clearly converged. The plot fitted well in a straight line with a high R2 correlation coefficient value of more than 0.95.
| Adsorbent pH | qe (mg/g) | K2(min.g/mg) | R2 |
|---|---|---|---|
| 4 | 0.0997 | 2.56 | 0.984 |
| 6.5 | 0.165 | 0.08 | 0.936 |
| 8 | 0.067 | 0.0954 | 0.942 |
Table 6. Pseudo-second-order kinetic parameter.
It can be concluded that the experimental values are closer to the equilibrium adsorption for pseudo-second-order model. As the pH value increases, the values of k2 and qe decreases and the calculated qe gave a consistent data with the experimental data. This indicates that the adsorption of Mg2+ using the adsorbent obeyed the pseudo-second-order kinetic model.
The usage of agricultural wastes can be utilized well and be used as beneficial product in industries. Statistical analysis revealed that the highest removal of Mg2+ is at pH 4, adsorbent dosage of 0.5 g, agitation speed of 150 rpm and a contact time of 180 minutes.
The maximum adsorption was 39.52 (mg/g) measured to be of 95%. The analysis revealed that the highest removal Mg2+ efficiency of 95% removal. It consists of the adsorbent dosage of 0.5 g, agitation speed of 150 rpm, contact time of 3 hours and pH value of 4. From the results obtained, it can be concluded that the experiment followed the Langmuir and Freundlich isotherm. In overall, using agricultural waste such as rice husk based raw material can help in the abundance of agricultural waste to create a more potential application.
The authors are grateful to UCSI University for funding environmental and sustainable engineering cluster project code Proj- In-FETBE-015. The authors are thankful to the authorities of University of Malaya for FESEM analysis under Ministry of Higher Education High Impact Research (UM.C/HIR/MOHE/ENG/20).