Research & Reviews: Journal of Pure and Applied Physics
ISSN: 2320-2459
ISSN: 2320-2459
1Department of Physics, College of Science, Raparin University, Sulaimanyah, Iraqi Kurdistan, Iraq
2Department of Physics, Faculty of Science and Health, Koya University, Erbil, Iraqi Kurdistan, Iraq
Received Date: 07/10/2017; Accepted Date: 22/11/2017; Published Date: 29/11/2017
Visit for more related articles at Research & Reviews: Journal of Pure and Applied Physics
The range and the stopping Power in the air and argon gas of alpha particle emitted by various sources which contain three isotopes (241Am, 244Cm and 239Pu), using surface barrier silicon detectors in a small vacuum chamber at various pressures. The stopping power of this charged particle in the air and argon from Bethe- Bloch formula was found to increase extremely as distance or pressure is increased. The range for this alpha source at a pressure of 1bar was found to be 5.8±0.1 cm in air and 6.0±0.1 cm in argon respectively with the stopping powers also found to be 1142.5±47.5 KeV/cm in the air and 1014.1±34.3 KeV/cm in the argon. The measured values of range were compared with another empirical formula from literature, while the measured values of the stopping power were compared with other empirically calculated values from the literature.
Americium-241, Vacuum chamber, Argon, Silicon detector, Energy calibration
Heavy charged particles interact with matter, such as alpha particle. This particle can pass through a medium with electrons and the nuclei of the material via Coulomb force. This mechanism of interaction loses energy by ionization or excitation of atoms. This is why alpha particles are the most dangerous to health.
Presently, Semiconductor radiation detectors are widely used for detection and measurement of heavy charged particles. A good energy resolution can be expected from this detector because it is the strong influence of the detector noise [1]. Surface barrier silicon detector used which made by deliberately oxidising from n-type material to a p-n junction. Near the junction when a reverse bias is applied, electrons diffuse across to combine with holes, creating a depletion region. When a charged particle penetrates in silicon, it is the electron-hole pairs created. If this recombination of free electrons and holes produced within a narrow region called the depletion region carriers give electric signal proportional to the energy given by the fundamental information of the incident charged particle. The electric field applied to the depletion region when the electron hole pairs created. It quickly sweeps the electrons to one terminal and the hole to the other [2].
The objective of this study is to determine experimentally the stopping powers of alpha particles in the air by using a silicon surface-barrier detector because it gives the best energy resolution. The various sources are utilized in this work such as various alpha sources including 241Am, 244Cm, 239Pu in the small vacuum chamber. This work will first present a brief background to this experiment, later on experimental method and results will be discussed, finally a conclusion section will be provided.
Alpha particles are a relatively massive in nuclei which are composite particles consisting of two protons and two neutrons tightly bound together. They are highly ionising, have a short range of a few centimetres in the air, and have typical energies of almost 5 MeV if no other decay products are involved, although that varies relying on the radioisotope [3].
Alpha particle decay takes place by emission of one alpha particle  ; as a result it can lose two protons and two neutrons.
For instance, alpha particle emitted by 241Am source and this source decays to an isotope of 237Np, according to the following
equation
; as a result it can lose two protons and two neutrons.
For instance, alpha particle emitted by 241Am source and this source decays to an isotope of 237Np, according to the following
equation
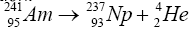
Where  represents the parents nuclide,
  represents the daughter nuclide and the alpha particle can be
represented by
represents the daughter nuclide and the alpha particle can be
represented by  [4].
[4].  is radioactive isotope with half-life of 432.2 years, which emits alpha particle through a series of
decay as shown in the Figure 1. Americium-241 decays from the excited state to ground state of neptunium-237 through emission
of gamma [5,6].
is radioactive isotope with half-life of 432.2 years, which emits alpha particle through a series of
decay as shown in the Figure 1. Americium-241 decays from the excited state to ground state of neptunium-237 through emission
of gamma [5,6].

Figure 1: Radioactive decay scheme of Am-241.
The amount of energy loss by an alpha particle per unit path length is commonly called as the stopping power of the medium, as defined by:
 (1)
(1)
Where E is the charged particle kinetic energy and x is the path length. The amount of –dE / dx along a particle track is also known a specific energy loss. Thus, the quantity S is referred to as a specific energy loss. This quantity can represent in the total energy which loss per number of interacting particles. It is proportional to the square of the charge of the incoming particle, and it is inversely proportional to it is velocity. So, the stopping power increases when velocity of particle is decreased. Also, the stopping power can be referred to the term linear energy transfer, which is used an approximation of the stopping power of penetrating particles [7].
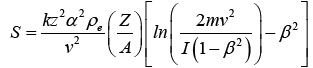
The stopping power of particles is described by the Bethe-Bloch formula, defining the rate of the energy loss of a charged particle:
 (2)
(2)
Where k is a constant, zis the atomic number of moving particles, ρe is the electron density, m is the mass of the electron, Z is the atomic number of the stopping medium, A is the atomic weight, v is the velocity of the moving particle, I is the average ionization potential of the medium and β is velocity particle per speed of light [2].
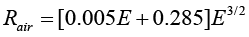
The range can be expressed by the stopping power of the material. In this experiment, the range in air of the alpha particle emitted from 241Am source. So, the absorber thickness decreases the alpha particle energy which travels through matter is called the range of the alpha particle, the distance in a medium at which their energy is about zero because the particle collides with many electrons which they lose energy gradually. The range depends on the type of particle, its energy of motion and on the material through which it travels. For example, if alpha particle is equal to 5.5 MeV which is emitted by 241Am and has a range of almost 4 cm in dray air at room temperature and pressure. Hence, the alpha particle range in gas can be expressed by below equation:
 (3)
(3)
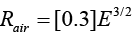
Where Rair is the total linear range in cm and E is the initial energy in MeV. Pervious equation can be applied for range of alpha particle energy 4-15 MeV. Based on measurements of both Fenyves and Haiman, they have described that the range with energies between 4-7 MeV can be expressed by this equation:
 (4)
(4)
The range relies on the density in the medium. The range of alpha particle in solids and liquids may be approximated by comparison with ranges in air based on eqn. (5) which is explained by:
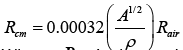 (5)
(5)
Where Rcm is the total range in cm of alpha particle in an absorber and A is the atomic weight of the solid or liquid. In formula 5, range of alpha particle in the medium as solid and liquid are shorter than the range in gas medium. Therefore, the high density of both solid and liquid provides more interaction between molecules of the medium and the alpha particle [4].
Energy Resolution
The configuration of the detector of the alpha counter has checked and the circuit in the system was set up. A silicon surface barrier detector connected to preamplifier, it can generate a voltage pulse each time when an alpha particle strikes its front surface. Then, the preamplifier is sent to high voltage from the bias voltage supply and pulser. At preamplifier and the signal was connected to the amplifier as a voltage pulse. Later on, the amplifier was connected to the computer (PC) to readout via multichannel analyser which records and stores pulses according to their high. Furthermore, from the amplifier, the output signal was connected to the oscilloscope for readout. The gas line is set up and both the silicon detector and alpha particle source inside a glass vacuum chamber as described and shown in Figure 2.

Figure 2: Schematic representation of the gas line connection and small vacuum chamber.
A vacuum chamber can be a rigid enclosure from that air and other gases has been removed by a vacuum pump. In this case, the detector (Si detector) is fixed inside a small vacuum chamber without touching the front face of the detector. Then, using ANS42 source which contains three isotopes such as (241Am, 244Cm and 239Pu), as alpha particle sources is placed inside the chamber. At the beginning, the investigation found that the best voltage of the detector for small vacuum chamber. So, we fixed the source without changing the distance which it has been taken about 1 cm far from the Si detector. Now an anode voltage of 50 volts to 350 volts was applied for 180 seconds and the values of channel number, Full Width at Half Maximum (FWHM) and Resolution (FWHM/Channel no) were recorded. Moreover, information about how this calculation was obtained will be explained in the results and discussion.
Energy Calibration
The detector was calibrated using ANS42 source box of (241Am, 244Cm, 239Pu) for a small vacuum chamber provided for 180 seconds; the power supply was connected at a voltage 200 volt to measure various sources. These radioactive sources putted in front of the detector. Finally, using MAESTRO that channel numbers were determined for the alpha-particle. The real values of energy for them were typed in Multichannel Analyser (MCA). In Figure 3 can show that the alpha particles were emitted from a various sources which have the different energy and intensity. For instance, the energy of 241Am is about 5485.56 KeV, but intensity is about 84.8 W/m2.

Figure 3: Characteristic features of a various sources.
Energy Resolution
As mentioned in the experimental procedure section of this report, various sources were used for studying the energy resolution of the counters. Using MAESTRO was found the channel numbers H0 and Full width half maximum FWHM resolution of the alpha particle peak. Then, the energy resolution was measured by using below equation:
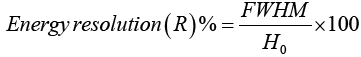 (6)
(6)
Figure 4 shows how the voltage changes with FWHM. There are several good points between 100 volt and 300 volt. Therefore the biased voltage of 200 volt selected as the optimum voltage of the detector. It noticed that below 50 volt, no signal was detected and the voltage above 350 volt was not tested as instructed by laboratory demonstrated.

Figure 4: A graph of the energy resolution against bias voltage.
Energy Calibration
The system was calibrated by using various sources (241Am, 244Cm, 239Pu) for a small vacuum chamber. These targets have different atomic numbers, and as such they generate various energy. All details are shown in Table 1.
Table 1. The average energy of various source and channel numbers.
| Sources | Atomic Number | Channel Number | Energy (KeV) |
|---|---|---|---|
| Cm | 244 | 685.20667 | 5804.77 |
| Am | 241 | 648.41667 | 5485.56 |
| Pu | 239 | 608.05 | 5156.59 |
Figure 5 also shows the linear relationship between the channel number and the energy of alpha particle. It is clear that the relationship between the energies of the radioactive source with channel number corresponds to the linear, and it was found that: Full peak energy (keV)=8.3968x + 47.712 Where x represents the channel number of peak.

Figure 5: A graph of energy against channel number for Small detector.
Energy Loss of Alpha Particle in the Air
Measuring energy of the alpha particle when it has detected by the surface barrier detector, it was passed through the gases as a function of source to detector distance, according to the Beth-Bloch equation.
The alpha source placed inside a small vacuum chamber at 1 cm then changing the distance of 2 to 8 cm passed through by the particle in the air from the detector at standard pressure 0 bars. After that turned off the vacuum pump and varying the pressure. The study is that recorded the data on the alpha peak for each distance and obtained the corresponding energy using the energy calibration. Consider that the relationship between the energy of various sources and the range how the energy of the alpha particle decreases due to distance. When the pressure was equal to zero, there is approximately no energy loss in this case since there is almost no particle of air to interact with in the vacuum.
This procedure was repeated at a pressure between 0.2 bars to 1.0 bar. So, the alpha particle loses energy faster with increase pressure and also increasing distance. Since, there is now an interaction between the alpha particle and the molecules of air.
Figure 6 can show that the alpha particle within an air medium, as can see the energy of alpha particles or the range that alpha particles can travel for longer and shorter way which is relying on the pressure of the medium. Moreover, the number of the alpha particles when reaches the detector decreases by increasing distance. So, the energy of the alpha particles should be decreased.

Figure 6: A graph of energy in air against the distance with varying pressure.
When approximately pressure was 1.0 bar, the energy loss in this case increases most rapidly since there is now an avalanche of interaction between the alpha particle and the molecules of air, and the energy eventually becomes zero at a distance X=5.8 cm.
Energy Loss of Alpha Particle in Argon Gas
The same as energy loss of alpha particle when it passes through the air thickness in a vacuum (approximately pressure is 0 bar). There is approximately no energy loss in argon gas since there is almost no molecule of gas to interact with in the vacuum. Notice that from Figure 7 that the energy of alpha particle in argon gas decreases sharply as distance increased [8]. Also, the alpha particle losses energy faster in argon gas then either by stopping power dE / dx which relies on the atomic number Z and the number of density N. The energy of alpha particle loss gradually based on increasing pressure. As shown from Figure 7, the energy loss completely at distance 6, 7, 8 cm when the pressure reached 1.0 bar.

Figure 7: A graph of energy in argon gas against the distance with varying pressure.
Stopping Power of Alpha Particle versus the Pressure of Air and Argon
The results of the values of the measured the stopping power and those computed empirically are shown in the Table 2.
Table 2. Stopping Powers of alpha particle in air and argon gas at different pressure.
| Pressure (bar) | Stopping Power for Air (KeV/cm) | Stopping Power for Argon (KeV/cm) |
|---|---|---|
| 0.0 | 13.647 ± 1.782 | 17.993 ± 5.273 |
| 0.2 | 179.17 ± 12.892 | 159.94 ± 3.31 |
| 0.4 | 391.69 ± 13.423 | 368.26 ± 10.70 |
| 0.6 | 739.0 ± 40.107 | 613.37 ± 26.64 |
| 0.8 | 929.45 ± 940.13 | 822.73 ± 25.56 |
| 1.0 | 1142.5 ± 47.5 | 1014.1 ± 34.3 |
Figure 8 shows a plot of the change of the stopping power of alpha particle in the two gaseous medium. It can be concluded that the stopping powers agree with the Bethe-Bloch formula since in each case, the stopping power increases as the density (i.e. pressure) of the gas increases. It can be seen that at any given pressure, the stopping power is highest in the air.

Figure 8: A graph of the stopping power against the pressure for air and argon gases.
Finally, the results of the values of the measured range and the stopping power, and those computed empirically from  [9] as shown in the Table 3.
Table 3. Ranges, empirical and measured values of alpha particle stopping power in air and argon.
| Gaseous Medium | Measured Range (cm) | Empirically calculated Range (cm) | Measured Stopping Power (KeV/cm) | Empirically calculated Stopping Power (KeV/cm) |
|---|---|---|---|---|
| Air | 5.8 ± 0.1 | 4 | 1142.5 ± 47.5 | 1367.9 |
| Argon | 6.0 ± 0.1 | 4.9 | 1014 ± 34.3 | 1131.0 |
In conclusion, it can be seen that when the pressure is close to that of a vacuum, alpha particle tend to travel unimpeded through the medium. This is, perhaps, due to that there are no particle to interact with in order to lose some kinetic energy. As the pressure is increased, interactions start to occur. Therefore, the alpha particle begins to lose some kinetic energy to the molecules of the gaseous medium. This energy loss increases as the pressure increases and this is quite identical to an increase in attenuation of gamma rays by materials as the thickness of the material increases.
According to the obtained results the energy of the alpha particle loss as a function of pressure. Moreover, from Bethe-Bloch formula the rate of energy dE / dx is proportional to the density. This means that the Stopping power increases as the density increases, since the higher the molar mass of a gas, the higher its density. Furthermore, the stopping power of alpha particle in the air is higher than in Argon gas and hence the range is highest for argon gas. However, it also makes sense to know that air molecules contain some trace amounts of other elements as well. The values of the measured ranges and stopping power are very close to the empirically calculated ones as shown in the obtained results. Accordingly, more work needs to be done to verify if at extremely high pressure, gases can attenuate other charged particles significantly as well.