Research & Reviews: Journal of Pure and Applied Physics
ISSN: 2320-2459
ISSN: 2320-2459
Henri J. M. Salles*
Independent Researcher, 361 Edlee Ave. Palo Alto, CA 94306, USA
Received Date: 07/10/2017; Accepted Date: 31/10/2017; Published Date: 03/11/2017
Visit for more related articles at Research & Reviews: Journal of Pure and Applied Physics
The entanglement phenomenon challenges our human way of thinking. As of today, while quantum statistical mathematics predicts correctly the behaviours of entangled particles non-statistical mathematics fails to concur with experiments. This paper overcomes this challenge. A new non-statistical equation is introduced, replacing the one that fails; this non-statistical equation is justified by physical experiments just as quantum statistical mathematics is. The valid non-statistical equation proposed here describes each individual particle’s specific behavior and subsequent measurement, a feature missing in quantum statistical mechanics. And for perplexed scientists, it is shown how this valid non-statistical mathematics metamorphoses Bell’s inequalities into equalities.
Statistical, Non-statistical, Interpretation, Entanglement, Computersimulation
Entangled pairs are made of two particles, such as two photons or two electrons that are emitted from a single source, in two opposite directions toward two sensors or detectors.
The quantum state appears precisely at emission of each pair, at which time the two particles lose altogether their individual characteristics; uncertainty takes over as any entangled pair no matter when emitted shares a universal quantum state.
Even though entangled, the two particles of any pair do travel away from each other, and are later measured independently of each other; as soon as one particle of any pair is measured though it instructs instantaneously over distance the other particle to comply and to be measured identically; that occurs independently of the detectors orientations, and the distance separating them, a phenomenon known as non-locality; the quantum state for that pair vanishes precisely at time of measure.
This amazing behavior is correctly predicted by quantum statistical mathematics which characteristic is to provide a unique statistical percentage concerning the final measures.
This statistical result bolsters uncertainty as it circumvents any single particle behavior description.
And to confirm uncertainty all attempts of describing mathematically the individual particles behaviors with respect to their respective detectors or sensors failed to concur with physical measures; let’s face it, the non-statistical mathematics as of today does not conform to reality.
To complicate the issue, or besides the failure of this non-statistical mathematics the Einstein–Podolsky-Rosen or EPR paper [1] first published in 1935 proves mathematically that the description of reality given by quantum statistical mathematics is incomplete; it mandates that hidden variables are acting behind the scene, in effect challenging quantum uncertainty.
Yet almost thirty years later, in 1964, John Stewart Bell came up with his famous inequalities [2], establishing that should future physical experiments justify quantum statistical mathematics predictions, there would be no hidden variables and there would be no way to describe the phenomenon through any non-statistical mathematics; Bell’s theorem mandated that either quantum statistical mechanics or non-statistical mathematics be valid, both cannot be valid at same time, either one excluding the other.
Physical experiments conducted later in the 1980s by Alain Aspect [3], and many others since, have definitely established the accur acy and veracity of quantum statistical mathematics.
In order to fix the non-statistical mathematics inconsistency it suffices to:
1. Come up with non-statistical mathematics that conforms to experiments; such mathematics needs only to describe and explain the individual behaviors of the two particles of each and every entangled pair.
2. Then Bell’s inequalities implications must be resolved.
These two procedures are fully accomplished in this paper.
In the following in order to be descriptive and efficient, electrons alone have been chosen to embody the entangled pair’s particles.
Entanglement Description
In 1980 Mermin wrote a paper [4], which as per his own introduction is describing in details “some of the most peculiar behavior to be found in the atomic world”.
If reader intend to pursue author recommend the readers to read, and maybe re-read Mermin’s paper; author’s paper, while inspired by his paper, nevertheless differs greatly from it; the two papers written for everybody provide two totally different interpretations of the same reality.
Angular Reference
Figure 1 represents Mermin’s “Complete device” as is implemented in physical experiments. It is made of two detectors A and B on either sides of an emitter C of entangled pairs of electrons.

Figure 1: Entanglement experiment and angular reference.
In this paper the angular orientations of the detectors and of the electrons are all referred to the horizontal labeled 0 degree detector A is oriented at 0 degree while detector B is oriented at 120 degrees.
Magnetic Detectors
While in above Figure 1 the two detectors A and B are respectively oriented at 0 and 120 degrees, each detector in the experiments is made of a switch having three positions; the switch controls the orientation of a magnet, referred as a Stern- Gerlach magnet; such magnet is graphically represented here by a circumference and a diameter line delineating the North Pole, labeled with a capital “N”, from the South Pole “S” represented in grey. Figure 2 illustrates three orientations that a detector may be given as mentioned by Mermin; they are the horizontal orientation at 0 degree (same direction as 360 degrees) as shown left of Figure 2, and two orientations at plus and minus 120°.

Figure 2: The three orientations given to a detector: 0 degree and + and –120 degrees.
Three detectors are specifically considered as that precise number in science defines the quantum state.
The object here is not to explain Quantum Statistical Mathematics, well described in the literature, but to mention that the quantum state is made of the eight combinations of measures that a single electron may engender through three detectors; it must be noted that this quantum state is independent of the detectors orientations as well as of the electrons orientations, confirming the fact that a single quantum state applies to all pairs of all times.
Electron’s Spin, Its Magnetic Characteristic and Orientation
An electron is made of a rotating electric charge acting as a magnet, which north pole is defined with the right hand rule; curving the right fingers along the electron’s spin, the thumb points north, which defines the direction of the electron; here an electron is represented with a bar and two small “s” and “n” letters for their south and north poles.
Now according to Mermin’s article [4], the measures indicate that the two electrons of any pair are identical:
The detectors flash the same colors when the switches have the same settings because the particles carry the same instructions.
As such the angular orientations of the two electrons of any entangled pair are identical; Figure 3 represents 24 pairs emitted sequentially in time from left to right; their angular orientations are referred to the 0 degree reference and positively represented counter clock wise.

Figure 3: Represents 24 pairs emitted sequentially in time from left to right.
Point# 1: In this paper the two electrons common angular direction of any entangled pair is well-defined at emission. And these well-defined directions must be evenly distributed over the 360 degrees spectrum, as shown Figure 3.
Within this 360 degrees spectrum, let us consider the sector starting at 0 degree (also 360 degrees) and ending at 135 degrees. Even though any other convention could be chosen, that sector is defined as not including the electron at 0 degree but including the electron at 135 degrees.
In other words any sector is defined including the upper limit electron and excluding the lower limit electron.
Twenty four electrons have been chosen in Figure 3 and in all of this paper as that number can be evenly divided by three and by four, two situations that are most significant as shown later.
The Green versus Red Measures
Figure 4, which represents a complete device, illustrates how the individual measures are performed and the resulting signals; in this specific case a single entangled pair of electrons oriented at 30 degrees is represented within both detectors A and B. If electron and detector magnets North Poles match, they flash GREEN (or G). When they do not, they flash RED (R).

Figure 4: Measurement of an entangled pair.
Mermin provides the Quantum Statistical Equation, which is justified by experiments, it is:

(Quantum Statistical Equation)
The angles θA and θB (read theta) are the orientations of the two detector magnets. This Statistical equation, integral part of quantum physics, corroborates the physical experiments.
When the detectors are oriented at 0° and 120°, as in Figure 4, the statistics provided by this equation are same colors (either GG or RR) one-quarter of the times, opposite colors (either RG or GR) three-quarters of the time, which is precisely what the measures provide.
Now let’s go back to the non-statistical world; when emitted the entangled pairs angular orientations are evenly distributed across the 360 degrees spectrum (Figure 3); the two electrons of each pair have a common orientation (Point#1).
The goal is to describe mathematically the behavior of each electron of each pair and the resulting measures when performed as per Figure 4; a feature missing in Quantum Mechanics.
The electrons emitted between 0 degree and 135 degrees represents three quarters of the electrons orientations above the horizontal. The remaining electrons emitted between 135 degrees and 180 degrees coincides to the remaining quarter.
In order to match the physical experiments, it suffices to come up with an equation that modifies all the electrons orientations from 0 degree to 135 degrees to orientations from 0 degree to 120 degrees as shown Figure 5, and to compare these new values to their detectors.

Figure 5: Electrons deviations and measured angles as a function of the electrons emitted angles.
Because the two hemispheres above and below the horizontal are symmetrical the same one quarter to three quarter’s distribution will apply to the circle’s lower half.
For any electron emitted between 0° and 180°, the equation that provides θElecDeviation as a function of θElecEmission is as follows.
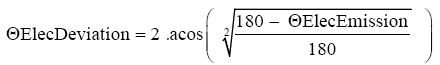
(Non-Statistical Equation, Conforming to Experiments)
This Non-Statistical Equation does not exist in science. This Non-Statistical Equation modifies the two electrons’ orientations of any pair in the same amount. This common deviation is function of the pair emitted orientation only. The 2 electrons orientations of a pair are deviated in the same amount, not because as soon as one is measured it instructs instantaneously over distance the other to comply (quantum non locality interpretation), but because they carry the same instructions and their deviation is independent of their respective detectors’ orientation.
The Non-Statistical Equation processes the electron emitted at 135 degrees as follows:
a) 180-135=45 (top subtraction appearing under the root symbol)
b) 45/180=0.25 (the division by 180 appearing under the root symbol)
c) Square root (0.25)=0.5 (square root of the above b calculation result)
d) acos(0.5) (in radian)=1.0471975511966 (inverse cosine in radian of 0.5)
e) acos(0.5) (in degrees)=60; (inverse cosine in degrees)
f) Precessed angle=2 × 60=120 (showing that an electron emitted at 135 degrees will be measured by the detector at 120 degrees).
This Non-Statistical Equation does not modify electrons emitted at 0 degree. As a result all electrons emitted above 0 degree up to 135 degrees included will be measured by Detector B as if they were emitted between just above 0 degree and 120 degrees included; these measures conform to experiments.
Unlike Quantum Statistical Equation, this Non-Statistical Equation provides the behavior of every single electron, doing away with the concept of uncertainty.
Point# 2: When entering a detector the electrons are deviated, in accordance with the Non-Statistical Equation Conforming to Experiments in a way that depends only on their own magnetic spin axis orientations; the detectors orientations are not involved in these deviations.
Once this transformation occurred, that is once the electron entered the detector and has been deviated as per above Non- Statistical Equation Conforming to Experiments the measure takes place, taking now in account the Detectors specific orientations.
Point# 3: The electrons modified orientations as per Point# 2, are then confronted to their respective detectors orientations and measured as such.
This “Non-Statistical Equation” mandates that both electrons and detectors are at play, the former being absent from “Quantum Statistical Mechanics”.
Without questioning Quantum Statistical Mathematics, the Non-Statistical Equation overthrows both concepts of uncertainty and non-locality.
For the record author used his imagination and intuition in conjunction with a lot of trial and error to establish this Non- Statistical Equation Conforming to Experiments; in other words author did not establish a mathematical process leading to it.
Please note that the 120° detector setting used in all of above is not restrictive; the 2 detectors can be set at any of two values other than 0 and 120 degrees; this Non-Statistical Equation when applied before the measures by the detectors take place, will provide the correct answers Conforming to Experiments just as the Quantum Statistical Equation does.
As a side note, in this paper the case in which the detectors are oriented at 0° and 120° from each other only is considered; and that differs from Mermin’s description; in Mermin’s experiments each of the two detectors are randomly set at 0 degree, 120 degrees and 240 degrees. When the two detectors are set alike, that is either both set at 0 degree, or both set at 120 degrees or both set at 240 degrees, the two electrons are always measured alike, providing always both colors RR or GG. When the detectors are oriented at random to any of the 0, 120 and 240 degrees orientations, but excluding the three cases in which they are set alike as just mentioned, the measures provide one quarter to three quarters matched measures (RR or GG) to unmatched measures (RG or GR). And that turns out to be the same as when only one configuration such as the 0 degree to 120 degrees of Figure 4 is used. This coincidence is inherent to the angle difference “ θA − θB ” appearing in the Quantum Mechanics Equation.
All in all considering this 0 and 120 degrees detectors orientation only, as done in this paper, is not restrictive; it greatly simplifies explanations and figures though.
And if readers read Mermin’s paper [4] attentively readers might have noticed a mishap [page 943] he writes:
“It is well-known elementary result that when the orientations of the magnets differ by an angle θ, then the probability of spin measurements of each particle yielding opposite values is cos2(θ/2). This probability is unity when θ=0 [Case (a)] and ¼ when θ=+or – 120 [Case (b)].”
In this specific text Mermin claims erroneously that spin measures yielding opposite values have a value of cos2(θ/2). Yet, for θ=120°, cos2(θ/2) is 0.25, which, in reality coincides with measures yielding the same values.
This represents an isolated mishap. Throughout his paper Mermin claims repetitively instead that 0.25 coincides to spin measures of same values, and not to spin measures of opposite values.
Science’s Non-Statistical Interpretation in Force in 1964
Figure 6 illustrates geometrically Science’s Non-Statistical Interpretation of the time; it departs greatly from above Non- Statistical Interpretation Conforming to Experiments.

Figure 6: Non-Statistical interpretation contradicting experiments.
In Figure 6 Detector B is represented overlapping detector A; four overlapped zones appear that are 0 to 120 degrees, 120 to 180 degrees, 180 to 300 degrees, and 300 to 360 degrees.
Having in mind paragraph “2.4 The Green versus Red measures” the acronym AG stands for: detector A should flash G, the acronym BG stands for: detector B should flash G, etc.
In this conspicuous interpretation, one sixth of the electrons are expected to flash same colors GG (sector 120 to 180 degrees) another sixth expected to flash RR (sector 300 to 360 degrees), while the remaining two thirds are expected to flash opposite colors RG or GR.
And whether 24 entangled pairs or millions of entangled pairs are emitted, as long as they are evenly distributed across the 360 degrees spectrum, the measures should provide at least one third even measures, either RR or GG, to two thirds disparate measures that are RG or GR.
The expression “should flash” and “are expected” are used as these results do not conform to reality.
Bell’s Inequalities Revisited
Bell expressed is famous “inequalities” before any physical experiments took place; as such Bell could not decide which one of the following two contradictory mathematical interpretations would turn out to be valid:
In accordance with above “conspicuous interpretation” (5.1) at least one third matched colors to two third disparate colors should be provided by the future experiments.
B. Yet as shown in 3 Quantum Mechanics Statistical Equation, Quantum Statistical
Mathematics predicted instead a much lower one quarter to three quarters matching un matching distribution.
These two interpretations represented two contradicting outcomes or “inequalities” that mandated two different contradictory mental interpretations of the physical world; either the “conspicuous interpretation” had to rule or the quantum statistical interpretation had to rule.
And specifically should the quantum statistical interpretation rule, as confirmed later, the “conspicuous interpretation” would actually be impossible, an interpretation in effect sweeping under the carpet it’s invalidity.
This Science’s former non-statistical mathematics “conspicuous interpretation” is simply invalid and replaced in this paper by the new Non-Statistical Equation Conforming to Experiments, which allows to restate above “a” and “B” statements as follows:
This paper’s Non-Statistical Equation Conforming to Experiments predicts one quarter to three quarters matching unmatching distribution.
Quantum Statistical Mathematics predicts one quarter to three quarters matching un-matching distribution.
Using valid Non-Statistical Mathematics Conforming to Experiments in place of the former “conspicuous interpretation” metamorphoses Bell’s inequalities into equalities.
This can be summarized as follows: resting on a “conspicuous” yet invalid interpretation, Bell’s theorem is overthrown.
In the end, this paper is only denying invalid mathematics and abstract concepts:
All in all the proposed Non-Statistical Equation Conforming to Experiments does not challenge science at all; it only emphasizes the “conspicuous interpretation” (Figure 6) invalidity.
It does specifically not deny Quantum Statistical Mathematics; it is only denying the abstract concepts of uncertainty and non-locality attached to it.
And it is elegantly turning Bell’s inequalities into equalities!
Introduction of the PHP Computer Program Proposed
To verify the Non-Statistical Equation Conforming to Experiments would involve a great number of calculations, which would be cumbersome if not impossible to handle manually. A computer simulation is of the essence; and the PHP programing language has been chosen to do the job.
When the program [5] is initiated the file EPR_simulation_control_panel.PHP is called and displays the screen shown below; the user enters the two detectors orientations (chosen here to be 0 degree and 120 degrees), then chooses the number of entangled pairs emitted (chosen here to be 24), and finally chooses one of the two Non-Statistical Interpretations offered.
This computer simulation has been implemented on author’s laptop which has a limited computing ability; as a consequence the maximum number of pairs that can be initiated is 360 pairs. Twenty four pairs have been chosen in this example as that allows printing all the calculations performed on a single page, as appears next page (Figure 7).

Figure 7: Entanglement Simulation: Contro; Panel.
Upon clicking the “Start a run” button the program switches to the file EPR_substantiation.PHP, which makes the following operations:
For (pair_number=1, to , pair_number=last, chosen to be 24 above).
Using above number of pairs entered determine and memorize in the computer memory the electrons emitted angles of each pair; the result must provide an even distribution of the pairs across the 360 degrees spectrum as per Point# 1. If that does not occur the user is asked to reenter a different number of pairs.
Use above emitted angles to calculate the electrons deviations of each pair upon entering their detector using the Non- Statistical Equation Conforming to Experiments.
Finally perform for each of the above electron deviation the comparison with its own detector orientation, tabulate the colors flashed and display the results on the screen as shown next page.
The Non-Statistical Equation Conforming to Experiments clearly shows one-quarter to three-quarters, matched unmatched measures; a feature declared to be impossible to obtain in science (Figure 8).

Figure 8: The Non-Statistical Equation Conforming to Experiments.
Setting the Detectors at Various Angles
Detectors A and B may be set differently. Table 1 shows the results provided for nine different Detectors settings using the Non-Statistical Equation Conforming to experiments; it shows that the 0/120 degrees setting provides one quarter three quarters matched unmatched results. For all cases displayed the results coincide to Reality and Quantum Mechanics conclusions.
Table 1. Detectors A and B versus Non-Statistical Equation.
| Detectors A and B Respective Orientations |
Non Statistical Interpretation Conforming to Experiments |
|---|---|
| 0/0 | 12 GG; 12 RR; 0 GR; 0 RG; |
| 0/30 | 12 GG; 12 RR; 0 GR; 0 RG; |
| 0/45 | 11 GG; 11 RR; 1 GR; 1 RG; |
| 0/60 | 9 GG; 9 RR; 3 GR; 3 RG; |
| 0/90 | 6 GG; 6RR; 6 GR; 6 RG; |
| 0/120 | 3 GG; 3 RR; 9 GR; 9 RG; |
| 0/135 | 2 GG; 2 RR; 10 GR; 10 RG; |
| 0/150 | 1 GG; 1 RR; 11 GR; 11 RG; |
| 0/180 | 0 GG; 0 RR; 12 GR; 12 RG; |
Various Runs Using the Non Statistical Equation Conforming to Experiments
One may emitt 360 pairs instead of 24, which will yield more accurate results in the near extreme case A=0°, B=30°.
Therefore, the fact that each electron in an entangled pair acts individually in accordance with Non-Statistical Rules Conforming to experiments is demonstrated successfully. While the outcome of the individual measurements is shown to be deterministic, it nevertheless is in agreement with Quantum Statistical Mechanics.
Runs Describing Non-statistical Mathematics Used in Bell’s Inequalities
The computer simulation may also be used to calculate and display the Non-Statistical interpretation used by Bell to establish is famous inequalities. When this option is selected, each emitted electron orientation is directly confronted and measured against its detector orientation (as illustrated in Figure 6).
When the two detectors are set at 120° from each other, the invalid one-third to two-thirds distribution matched to unmatched measures occur, as highlighted below (Table 2).
Table 2. Non-Statistical mathematics used in Bell’s Inequalities.
| Detectors A and B Respective Orientations |
Non Statistical Interpretation Used By Bell to Define his Inequalities |
|---|---|
| 0/90 | 6 GG; 6RR; 6 GR; 6 RG; |
| 0/120 | 4 GG; 4 RR; 8 GR; 8 RG; |
| 0/135 | 3 GG; 3 RR; 9 GR; 9 RG; |
Note that the 0/135 degrees Detectors orientations provide one to three quarters distribution, a fact coinciding to the 135 degrees angle span being three quarters of 180 degrees.
This suggests that a Non-Statistical equation, involving the detectors instead of the electrons can be enunciated.
Non-Statistical Equation, Involving the Detectors
Let’s call the 120° detector orientation θDectNominal and the 135° detector orientation θDectEffective.
θDectEffective and θDectNominal are related by the following Non-Statistical Equation, which is none else than the Quantum Statistical Equation expressed in terms of degrees:

(Non-Statistical Equation in terms of Detector Orientation).
For your information this equation is not considered in science either.
Considering any experiment, this latest Equation has to be applied successively to detector A and detector B to find their respective effective orientations. This Equation transforms 120° θDecNominal into 135° θDecEffective; and the same Equation transforms 0° θDecNominal into 0° θDecEffective; once these two operations have been performed, the individual electrons have to be successively compared to these two detectors effective orientations; these comparisons provide results conforming to experiments.
And as usual the 120° detector setting mentioned here is not restrictive; θDecNominal can be given any value between 0 and 360 degrees for both detectors, this Non-Statistical Equation in terms of Detector Orientation will provide the right yet nonstatistical answer just as Quantum Statistical Equation does.
Because the detectors are very likely not physically reoriented in the physical experiments this equation shows that mathematics describing correctly reality might nevertheless have no connections with reality.
Comments
1. The Quantum Statistical Equation does not take in consideration Point# 1, which involves an even distribution of the pairs angular orientations over the full 360 degrees spectrum; in order to calculate each pair deviation using either of the two Non-Statistical Equations Conforming to Experiments such distribution in turn mandates the knowledge of each pair angular orientation; that represents definitely a hidden variable predicted mathematically by EPR.
2. Then a question came to author’s mind. What is the relationship between the quantum state and the quantum equation? The quantum state involves 3 detectors’ orientations (Figure 2); yet the quantum equation involves only 2 detectors’ orientations: θA and θB. Searching through available literature author personally could not find the relationship.
3. The Non-Statistical Equation Conforming to Experiments proposed here might not be the final answer! It is based on the motion of the electrons, which differs greatly from the motion of the photons. As such, unless someone finds a valid explanation, yet “another” mathematical interpretation might be needed to satisfy now the photons’ behaviors!
A valid Non-Statistical Solution concerning the entanglement phenomenon is proposed; it replaces previous science’s invalid Non-Statistical Solution and is in accord with science’s Statistical Quantum Solution. This Non-Statistical Equation Conforming to experiments describes the behavior of each electron of each entangled pair, a performance missing to this day in science’s Statistical Quantum Solution.
This Non-Statistical Solution Conforming to experiments involves the following three Points:
Point# 1: The two electrons of any entangled pair are emitted with identical and known spin axis orientation. While the identical characteristic is part of quantum physics, the known characteristic departs frankly from the quantum state. This known characteristic actually does away with uncertainty.
Point# 2: When entering a detector the two electrons of any pair are deviated equally using the Non-Statistical Equation Conforming to experiments. While in accord with quantum statistical mathematics the pairs’ two particles are physically equally deviated not because when either particle of a pair is measured the other complies instantly over distance but in accordance with Non-Statistical mathematics Conforming to experiments.
Point# 3: The re-oriented electrons are then confronted to their respective detectors orientations and measured as such. And that departs from the Non statistical Interpretation used by Bell in that the results obtained do agree with reality and Quantum Statistical mechanics.
All-in all the results depend on both the electrons orientations and the detectors orientations, the former being absent in quantum mechanics.
This study restores logic concerning the non-statistical interpretation of the phenomenon; it simply provides a valid solution that replaces the invalid one.