Research & Reviews: Journal of Pure and Applied Physics
ISSN: 2320-2459
ISSN: 2320-2459
Mehdi Afshari Abolkarlou*
Department of Basic Sciences, University of Shahreza, Shahreza, Iran
Received: 10-Feb-2023, Manuscript No. JPAP-23-89211; Editor assigned: 13-Feb-2023, Pre QC No. JPAP-23-89211 (PQ); Reviewed: 27-Feb-2023, QC No. JPAP-23-89211; Revised: 21-Apr-2023, Manuscript No. JPAP-23-89211 (R); Published: 01-Jun-2023, DOI: 10.4172/2320-2459.11.2.011
Citation: Abolkarlou MA. Effect of Hydrogenation on Physical Properties of TiMn2 type Alloy. RRJ Pure Appl Phys. 2023;11:011.
Copyright: © 2023 Abolkarlou MA. This is an open-access article distributed under the terms of the Creative Commons Attribution License, which permits unrestricted use, distribution and reproduction in any medium, provided the original author and source are credited.
Visit for more related articles at Research & Reviews: Journal of Pure and Applied Physics
TiMn2 type alloys are considered as promising candidates for hydrogen storage materials. In this paper structural, morphological and magnetic properties of TiMn2 type alloy, before and after hydrogenation, were experimentally studied. The TiMn2 type alloy was hydrogenated under 50 bar hydrogen gas pressure. Structural and morphological properties of samples were investigated using X-Ray Diffraction (XRD) analysis and Field Emission Scanning Electron Microscope (FESEM) images. X-ray diffraction spectra showed the as-prepared and hydrogenated samples were both characterized as laves phases C14 with a hexagonal crystal structure (space group P63/mmc). The FESEM images illustrated the average grain size decreased, and sample surface was rather uniform after hydrogenation. Magnetic behavior of samples was checked using a Vibrating Sample Magnetometer (VSM) and depicted the samples are paramagnetism. The results obtained from Honda-Arrott plots indicated the magnetic susceptibility increases from 4.70*10-6 emu/g.Oe for as-prepared to 6.84*10-6 emu/g.Oe for hydrogenated sample.
Hydrogen storage material; TiMn2 type alloy; Hydrogenation; Hysteresis; Magnetic susceptibility
In recent years, with increasing of environmental problems and energy crisis, more and more sights have turned to new energy carrier. Hydrogen is an energy carrier that can be considered as an ideal fuel for many types of energy convertors. It is a convenient, safe, versatile fuel source that can be easily converted to a desired form of energy without releasing harmful emissions [1]. A key advantage of hydrogen is that when burned, Carbon Dioxide (CO2) is not produced. But, conveniently and economically hydrogen storage is one of the most critical problems in the use of hydrogen energy for practical applications. Many researches have been done on hydrogen storage materials to find good carriers for storing hydrogen [2].
Intermetallic compound is one of the most appropriate candidates for hydrogen storage. However, a main problem with intermetallic compounds is their low capacity (about less than 2 wt%). Two types of intermetallic compounds, suitable for hydrogen storage, are AB5 class of rare earth alloys and AB2 laves phase class of alloys [3-6].
Laves phases form the largest group of intermetallic compounds and show remarkable mechanical and physical properties. These alloys demonstrate high capacities and good cycle stability which are applicable in hydrogen supplies, heat pumps and Ni-Hydrogen rechargeable battery. AB2 laves phase (A stands for transition metals or rare earth elements and B stands for transition metals) are crystallized in three structures: Hexagonal C14 (MgZn2), Face Center Cubic C15 (MgCu2) and hexagonal C36 (MgNi2). They are known as size factor compounds because their formation is strongly dependent on the radius ratios of the A and B atoms; the A atoms are coordinated by a large number of B atoms, and, in the hexagonal structures, the lattice constants follow the relationship. Among these structures, C36 phase is less abundant and only C14 and C15 laves phase structures can store hydrogen [7].
Now TiMn2 laves phases alloys were studied widely due to low price, high storage capacity and easy activation. In Addition, TiMn2 type alloys are attractive candidates for negative electrode in rechargeable battery since they are cheaper than LaNi5 and ZrNi2. However, high plateau pressure and poor hysteresis are two critical problems for their various applications. The partial replacement of Ti and Mn by other elements can be a suitable way to reduce the plateau pressure and to improve the hysteresis [8-14].
The magnetic properties of some binary Laves phases containing transition metals alone are not well known. This is because of these compounds contain refractory elements that complicate melt processing due to high melting temperatures and extensive phase separation. By the way, Magnetic properties of Laves phase alloys have been investigated extensively. Christin, et al., researched on Fe and Co containing Laves phase alloys. Moreover, Koten MA, et al. studied, experimentally and using density functional theory, the magnetic and structural properties of WFe2 nanoclusters. Paduani, et al. investigated experimentally the effect of Mn content on structural and magnetic properties of the C14 laves phase (Fe1-xMnx)2Nb intermetallics, as well. Kazuko Inoue, et al., also studied magnetic properties of C14 laves phase RMn2 [15].
In this work, the structural, morphological and especially magnetic properties of TiMn2 type alloy were studied at room temperature before and after hydrogenation [16-20].
Experimental
In this study, TiMn2 type alloy (with a chemical formula Ti0.98Zr0.02V0.43Fe0.09Cr0.05 Mn1.5, Sigma-Aldrich company product) was hydrogenated at 50 bar hydrogen gas pressure. Figure 1 shows the both as-prepared and hydrogenated samples [21].

Figure 1: (a) As-prepared and; (b) Hydrogenated samples.
Structural properties of samples were determined by X-ray diffraction instrument (model XMD300) with Cu-Kα radiation (λ=1.5406Å) between 20° to 60°. Then XRD spectra were processed by Analytical X'Pert HighScore Plus software to obtain structural characteristics [22].
Also, morphological properties of samples were checked using a field emission scanning electron microscope (the device FESEM S.4160 model). A vibrating sample magnetometer was used to investigate the magnetic behavior of samples at room temperature. The magnetic susceptibilities, χ, were precisely determined from magnetization according to Honda-Arrott plot [23].
By extrapolating the measured values χm to H-1→0. By c is denoted a presumed magnetic ordered impurity content and Ms is their saturation magnetization. Therefore, the samples paramagnetic susceptibility, with ferromagnetic impurity c and saturation magnetization Ms, can be determined. By this method any possible alternation of magnetic susceptibility as result of the presence of magnetic ordered phase is avoided.
XRD measurement
Figure 2 shows XRD patterns of the TiMn2 type alloy, before and after hydrogenation. The crystal structure of samples was characterized as laves phases C14 (space group P63/mmc, JCPDS No. 50-1114). The (110), (103), (112), (201) and (104) peaks related to hexagonal structure of C14 were observed in both samples. In addition, a minor peak at position of 41.1° related to iron oxide (FeO) were also detected. As it is seen, intensity of the peaks (103), (112) and (201)is clearly reduced in hydrogenated sample which means that the peaks are broadened. This alteration isattributed to decrease of crystallite size and increase of lattice strain. Also, in hydrogenated sample the peak at49.49° related to FeO appeared that can be due to decomposition of alloy by replacing the hydrogen atoms ininterstitial sites.

Figure 2: XRD patterns of samples.
The crystallite size of the samples was obtained using Debye-Scherrer formula
D=0.9 λ/β cosθ (2)
where D is the crystallite size, λ is the X-ray wavelength, β is the Full Width at Half Maximum (FWHM) of diffraction peak and θ is the Bragg’s angle.
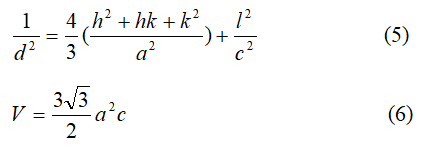
Where h, k and l are the Miller indexes, and d is the Bragg’s planes distance.
The Lattice strain (ε) and dislocation density (δ) were estimated using the equations (3) and (4), respectively.
The obtained results are summarized in Table 1. As it can be seen, the peaks position in both samples are compatible together. Also, comparison of FWHM amounts illustrate the broadening of the peaks after hydrogenation, expressing the reduce of crystallinity. Peak broadening is due to decrease of crystallite size (as the variations of D illustrate) and increase of lattice strain. It should be noted that the average crystallite size of as prepared sample was measured 42 nm, while it was obtained 30 nm for hydrogenated. Moreover, decreasing of the crystallite size causes strain and dislocation density to increase, expectantly. By hydrogenation process and presence of hydrogen atoms in interstitial sites, crystal lattice of the alloy is expanded which results the pulverizing the sample.
| Sample | hkl | 2 θ | FWHM | D (nm) | ε ×10-3 | δ×10-4 (line/nm2) |
|---|---|---|---|---|---|---|
| As prepared | 110 | 37.11 | 0.256 | 42 | 1.05 | 5.66 |
| 103 | 40.34 | 0.235 | 47 | 0.96 | 4.52 | |
| 112 | 43.54 | 0.228 | 49 | 0.92 | 4.16 | |
| 201 | 44.38 | 0.228 | 49 | 0.92 | 4.16 | |
| 104 | 50.99 | 0.443 | 23 | 1.7 | 18.9 | |
| Hydrogenated | 110 | 37.4 | 0.47 | 21 | 1.94 | 22.7 |
| 103 | 40.13 | 0.285 | 37 | 1.16 | 7.3 | |
| 112 | 43.54 | 0.389 | 26 | 1.57 | 14.8 | |
| 201 | 44.39 | 0.389 | 26 | 1.57 | 14.8 | |
| 104 | 50.742 | 0.252 | 44 | 0.99 | 5.16 | |
| As prepared | - | - | - | 42 | 1.11 | 7.48 |
| Hydrogenated | - | - | - | 30 | 1.44 | 12.95 |
Table 1. Obtained results from XRD measurement.
Lattice parameters a and c, calculated by the equation (5), c/a ratio and unit cell volume from equation (6) are listed in Table 2.
| Sample | a (nm) | c (nm) | c/a | V (nm3) |
|---|---|---|---|---|
| As prepared | 0.5087 | 0.7993 | 1.571 | 0.5376 |
| Hydrogenated | 0.5174 | 0.8705 | 1.755 | 0.5562 |
Table 2. Lattice parameters a and c, c/a ratio and unit cell volume of samples.
As one can be see, parameters a and c are increased after hydrogenation. However, increasing in parameter c is more than that in parameter a which is a result of volume expansion along c-axis upon hydrogenation, as the change of c/a shows it. Unit cell volume is also increased after hydrogenation. By hydrogenation and presence of hydrogen atoms in crystal structure, lattice is expanded and unit cell volume is increased. Finally, this leads to pulverize of sample, decrease in crystallite size and increase of lattice strain and dislocation density.
Morphological analysis
To investigate the effect of hydrogenation on the surface morphology and microstructure of alloy, the FESEM images were taken (Figure 3). As it can be seen, the as prepared sample has a non-uniform surface which is covered by larger grains and in some spaces they are agglomerated. After hydrogenation, the average grain size decreases and grains have nearly uniform size distribution. The internal stresses, which created in the lattice due to the volume expansion upon hydrogenation, can be attributed to the driving force that leads to pulverize of the TiMn2 type alloy. Figure 4 indicates the histogram plots of grain size distribution of samples. A Gaussian fit of these plots present average grain size of 106 nm and 76 nm for as prepared and hydrogenated samples, respectively. These results are in good agreement with them obtained from XRD measurement.

Figure 3: FESEM images of (a) as prepared; and (b) hydrogenated samples.

Figure 4: Histogram plots of grain size distribution of (left) as prepared and (right) hydrogenated samples.
Magnetic properties
Magnetization: Figure 5 illustrates the magnetization curves of TiMn2 type alloy versus applied magnetic field (from -10 kOe to +10 kOe), before and after hydrogenation, at room temperature. As it can be observed, both as prepared and hydrogenated samples indicate no magnetic hysteresis and are paramagnetic. Also, samples haven't been saturated, even by applying the magnetic field up to 8 kOe. The most magnetizations were estimated 0.04 emu/gr and 0.06 emu/gr for as prepared and hydrogenated samples, respectively. The magnetic susceptibility was measured about 4.72*10-6 emu/gOe for as prepared and 6.90*10-6 emu/gOe for hydrogenated sample. It can be seen that the magnetization and susceptibility are partially increased in hydrogenated sample due to decomposition of the partial amount of magnetic iron from alloy during the hydrogenation process. The magnetization curves reveal a paramagnetic behavior, and so it can be said that the hydrogenation process hasn't significant effect on magnetic properties of TiMn2 type alloy at room temperature.

Figure 5: Magnetization curves vs. applied magnetic field for as prepared and hydrogenated samples.
Magnetic susceptibility
The room temperature susceptibility can be determined from magnetization curve according to Honda-Arrott plot (equation (1)). Figure 6 shows the plots of M/H vs. 1/H for samples (solid line represents the fitted plot according to equation (1)). The results obtained from this measurement are summarized in Table 3.
| Sample | Ms from experiment (emu/g) | Ms from fitting (emu/g) | Magnetic susceptibility from experiment χ*10-6 (emu/gOe) | Magnetic susceptibility from fitting χ*10-6 (emu/gOe) |
|---|---|---|---|---|
| As prepared | 0.04 | 0.038 | 4.72 | 4.7 |
| Hydrogenated | 0.06 | 0.064 | 6.9 | 6.84 |
Table 3. Results obtained from fitting the experimental data by Honda-Arrott equation.
The magnetic susceptibility is increased from 4.70*10-6 emu/gOe for as-prepared to 6.84*10-6 emu/gOe for hydrogenated sample. This change must be due to decomposition of the partial magnetic iron from the alloy, as discussed in previous section. Furthermore, it can be attributed to lattice defects. As it can be seen, the results from fitting are in good agreement with those obtained from experiment (Table 3).

Figure 6: Fitting the experimental data by Honda-Arrott equation for TiMn2-type alloy (▲) before and (■) after hydrogenation.
To summarize, TiMn2 type alloy with chemical formula Ti0.98Zr0.02V0.43Fe0.09Cr0.05Mn1.5 was hydrogenated under 50 bar hydrogen gas pressure. X-ray diffraction patterns showed that the samples, before and after hydrogenation, are single phase with C14 type hexagonal crystal structure. The FESEM images indicated the sample surface is nearly uniform and the grain size is decreased after hydrogenation. Magnetic measurements exhibited no magnetic hysteresis for samples at room temperature, and they were paramagnetic. The magnetic susceptibility was increased slightly for hydrogenated sample which is attributed to increasing the crystal defects and decomposition of partial magnetic iron from the alloy after hydrogenation.
[Crossref] [Google Scholar] [PubMed]
[Crossref] [Google Scholar] [PubMed]
[Crossref] [Google Scholar] [PubMed]