Research & Reviews: Journal of Pure and Applied Physics
ISSN: 2320-2459
ISSN: 2320-2459
Tohid Sedghi*
Department of Electrical Engineering, Urmia Branch, Islamic Azad University, Urmia, Iran
Received: 07/02/2014; Revised: 24/02/2014; Accepted: 04/03/2014
Visit for more related articles at Research & Reviews: Journal of Pure and Applied Physics
In CBIR, local features play a significant role in determining the similarity of images along with the shape information of the objects so this reason encourage authors to apply local features in literatures. One of the famous shapes features are one-dimensional normalized contour sequence moments which extracted from Gradient Vector Flow fields are used to compute the edge image, which will capture the object shape information. GVF fields give excellent results in determining the object boundaries irrespective of the concavities involved. In addition, Other Shape feature such as Hu Moments and edge histogram are not as efficient as GVF Fields because in mentioned shape feature extraction methods omits useful information which decrease retrieval percentage
cyclostationary, process analysis, image
It is introduced efficient and simple modified CBIR system operation and detailed study of each block will be discussed in literature [1,2,3]. We have proposed two new methods for image retrieval novel textural feature extraction in transformed domain. Then newly proposed features are extracted from these tiles. Features drawn transformed image using Spectral function from each of non-overlapping tiles computed Norm-1 energy and standard deviation in each diamond shape region of FAM algorithm, serve as texture descriptors. An integrated matching scheme based on most significant highest priority principle and adjacency matrix of a bipartite graph constructed between image tiles, is implemented for image similarity. Gradient vector flow fields are used to extract shape of objects. Invariant moments are used to describe the shape features. A combination of these texture and shape features provides a robust feature set for image retrieval. Texture has qualities such as periodicity and scale; it can be described in terms of direction, coarseness, contrast and so on.. This method is based on spectral correlation function (SCF) that provides a second order statistical description in the frequency domain of signals. Then the SCF of each signal is calculated by FFT accumulation method which is a computational efficient algorithm. Features are energy and standard deviation of SCF of signals got from image at different regions of bifrequency plane. This scheme shows high performance in Image set. The newly proposed features computed on these tiles serve as local descriptors of texture. An integrated matching procedure based on adjacency matrix of a bipartite graph between the image tiles is provided, similar to the one discussed in [4-6], yielding image similarity. Then GVF field of the same image is computed. After that, invariant moments are generated. Distance from shape comparison between query image and dataset image is calculated, and which will be added to distance, computed by integrating matching scheme. The final distance is kept in system for future retrieval. Beside that this process is done between dataset images and query image then distance used to retrieval chosen numbers of retrieval images from dataset.
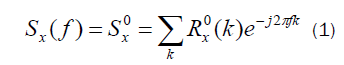
The SCF for a discrete-time real-valued signal x(n) is defined as the Fourier-series transform of the cyclic correlation function thus  is the cross spectrum of the pair of complex valued frequency-shifted signals x(n)
  and x(n)
  where f is the cross spectrum frequency variable and the parameter α , called the cyclic frequency, is the relative frequency shift. If the signal has finite average power then there are at most a countable number of values of α for which For α = 0 the SCF reduces to the ordinary power spectrum:
Several computationally efficient algorithms for cyclic spectral analysis have been introduced that generally fall into two categories: those that average in frequency (frequency smoothing methods) and those that average in time (time smoothing methods). In this paper we utilize one efficient algorithm from time smoothing category namely FAM. We explain only the fundamentals of time smoothing algorithms that tends to FAM method. All time smoothing algorithms are based on the time smoothed cyclic cross periodogram:
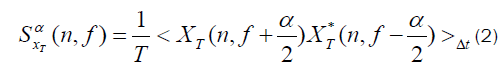
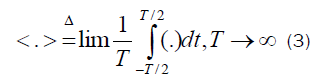
In (8), the operation < . > is the time averaging operation defined as follows:
and, the operation * is conjugate operator.
The physical interpretation of time smoothed cyclic periodogram is the correlation spectral components of x(n) over a time span of Δt seconds. The spectral components 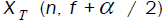 and
and 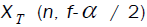 are the complex envelopes of narrow-band, bandpass components of a signal and called complex demodulates. For the calculating of
 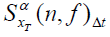 a data tapering window of length T slides over the data for a time span of Δt . At each instant the complex demodulates of the data within the window are computed. After calculation of the complex demodulates, they are correlated to produce estimates of the cyclic spectrum function. Correlation is done by time averaging of conjugate products over an interval of Δt seconds. To estimate the spectrum at the point
  demodulates separated in frequency by an amount α0 and centered about a midpoint of f0 are correlated. The quantity Δt and Δf are referred to as the time and frequency resolutions of the point estimate. Mathematically, computation of the complex demodulates is expressed as:
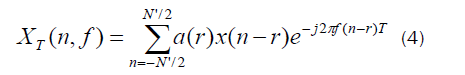
where a(r) is a data tapering window of length T = N’Ts . Then, the complex demodulates are correlated over a time span of Δt seconds:
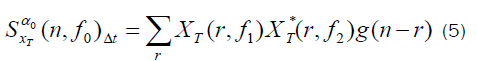
where g(n) is a data tapering window of width Δt= NTs ; f1 = f0 +α/ 2 and f2 = f0 -α/ 2 . It is shown in that the time smoothed cyclic cross period gram converges to the cyclic cross spectrum in the limit, as Δt →∞ followed by Δf →0 , if the time windows a(n) and g(n) are properly normalized. Therefore, if 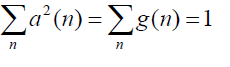
Then, 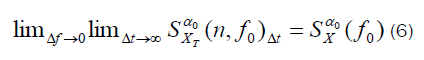
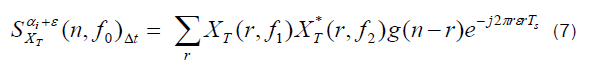
In the FAM algorithm, time smoothing is done by Fourier transform. If frequency is shifted from α0 t α0 +ε , the output of the system is given by:
If several values of ε are desired, evaluation of the sum can be simplified by discretizing the values of = qΔα . In this case the output of the algorithm is expressed as:
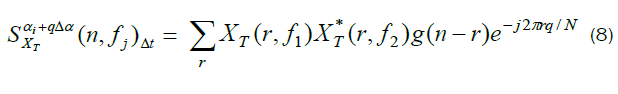
In which the sum can be evaluated with an N-point FFT. Thus, point estimates with constant cycle frequency can be computed in blocks by Fourier transforming the product sequences instead of averaging the product sequences individually. For complete coverage of the bifrequency plane a bank of bandpass filters is required to produce the necessary complex demodulates. An efficient method for producing the required complex demodulates is based on a sliding FFT. In this approach the frequencies of the filter bank are discretized to:
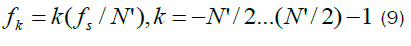
The locations of SCF estimation associated with the pairs of complex demodulates are ( f j ,α i ) where the frequency coordinates are:
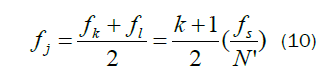
And the cycle frequency coordinates are:
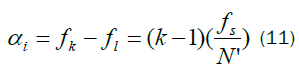
Fig. 5 shows tiling the bifrequency plane with the FFT accumulation method for N′= 8 and the locations of SCF estimation. For an N′point channelizer there are (N′)2 possible combinations of channelizer streams; hence, there are at most(N′)2 estimation regions (diamond regions). Due to symmetry, estimation of the cyclic spectrum of a single real signal requires only (N′)2/ 4 diamond region. After studying about SCF. First we partition an image into nine regions. Two, one dimensional signals are obtained from each of partition of partitioned image by ordering of pixels row by row and column by column. Then the SCF of each signal is calculated by FAM algorithm. For constructing the feature vector, the Norm-1 Energy and standard deviation are computed separately on each diamond shape region of SCFs from each signal and then feature vector is formed using these two parameter values. The basic assumption of using energy as a feature for texture discrimination is that the energy distribution in the frequency-domain identifies a textural information of an image. Resulting feature vectors from N number of regions from each partition of nine partition are as follows. where  ,
, N is the number of diamond regions at FAM algorithm and j is the number of patitions. Respectively, Ein j , and σinj, are the Norm-1 energy and standard deviation of the SCF amplitude that are calculated for the ith signal at the nth region namely D:
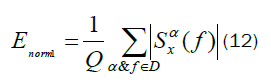
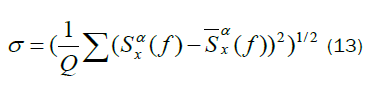
Where Q and  are the number of estimate points and the mean of spectral correlation function at corresponding D, respectively. At last for producing the main feature vector, we combine nine feature vector of each partition as follows to get the main feature.
In this section, the performance of system is evaluated using image set. There are two sets of images Id SetD={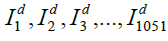 } and SetQ={
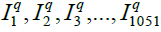 } Each contains 1051 full color images. The images in SetD are employed as the database images and those in SetQ are used as the query images, Where each image pair (
 ) are randomly picked up from the same animation. In each experiment, each
  is used as the query image. For each query, the system responds to the user L database images with the shortest image matching distancesopposite to . Table 1 shows Comparison of average precision (%) with proposed method and other standard retrieval systems. If
  exists among the L database images, we say the system has correctly found the expected image. Otherwise, the system has failed to find the expected image. In the following, the accuracy rate of replying a query will be explained with accuracy (ACC, %). Table 2 shows omparison of accuracy (ACC%) of retrieved image The experiment is to compare the retrieval accuracy of our system approaches.

Table 1: Comparison of average precision (%) with proposed method and other standard retrieval systems

Table 2: Comparison of accuracy (ACC%) of retrieved image
Local information is captured for two resolutions and two grid layouts that provide different details of the same image. Shape information is captured in terms of edge images computed using Gradient Vector Flow fields. Invariant moments are then used to record the shape features. The combination of the texture features between image and the shape features provide a robust feature set for image retrieval. It is this that makes texture a particularly interesting facet of images and results in a plethora of ways of extracting texture features. To enable us to explore different approaches for computing texture feature.