Research & Reviews: Research Journal of Biology
ISSN: 2322-0066
ISSN: 2322-0066
1 Kobe International University, Kobe 658-0032, Japan
2 Department of Physics, Kwansei Gakuin University, Sanda 669-1337, Japan
Received date: 03/04/2021 Accepted date: 17/04/2021 Published date: 24/04/2021
Visit for more related articles at Research & Reviews: Research Journal of Biology
A logistic formula in biology is applied to analyze the second and third waves of COVID-19 in Japan. We follow the observation that the removed number R(t) in the SIR model behaves like the population in biology. The logistic formula for R(t) is applied to predict the peaked date of infectious number and its total removed number for each wave.
The second wave started from July 20, 2020, and peaked at Aug 17 with its total removed number 22536 ± 568. The third wave started from Oct 11, 2020, and peaked at Jan 17 with its total removed number 175165 ± 1657. These calculated values agree well with actual data.
COVID-19; Logistic Applications; SIR model
The logistic formula is useful in the population problem in biology. It is closely related to the SIR model [1] in the theory of infection [2–9]. In previous papers [10–13] we have shown that the logistic formula can be approximately driven from the SIR model. In the present paper, however, we regard the logistic formula as the first principle, which is independent of the SIR model. We follow the observation that the removed number R(t) in the SIR model behaves like the population in biology, that is, R(t) is a sum of accumulated numbers of deaths and discharged. In Sec. 2 we give the logistic formula for R(t). Our policy is to use only data of removed by COVID-19 in Japan [14]. This formula will be applied to analyze the second and third waves in Secs. 3 and 4, respectively. These analyses revise results obtained in previous works [12,13]. The final section is devoted to concluding remarks. In Appendix we prepare error estimation formulas.
The logistic formula
In biology the logistic equation for a population N(t) is given by
where A, B and c are some parameters. The solution is easily obtained as
Here T gives a peak of I(t), which is given by
that is, I(t)=AB2/4.
The equation (2.1) can be regarded as the third equation of the SIR model,
if we identify N(t) with R(t), where R(t) and I(t) are the removed number and the infectious number, respectively, and c the removed ratio. In previous works [10-13], our logistic formulas (2.2) and (2.3) have been driven approximately from the SIR model. In the present paper, however, we regard our logistic formulation as more fundamental rather than the SIR theory. Let us rewrite Eq. (2.2) in notations A=a/d, B=d and N(t)=R(t) as follows:
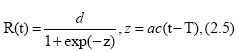
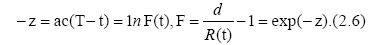
where d is the final total removed number, e. g., d=R(∞). Eq. (2.5) can be expressed as
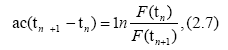
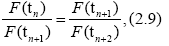
Accordingly, for different times tn, tn+1 and tn+2, (n=1, 2, . . .), we have
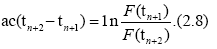
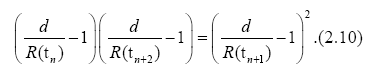
When time differences in Eqs. (2.7) and (2.8) are equal, we have a useful formula for d
explicitly,
Application to the second wave of COVID-19 in Japan
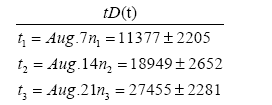
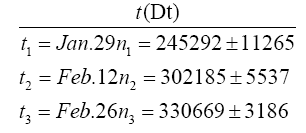
Our logistic formula is applied to the second wave of COVID-19 in Japan. This provides a revise of previous work [12] The R(t) is the accumulated number of removed in the second wave in Japan, which is an average for 7 days in a middle at each t with standard deviations, where t is the date starting from June 20, 2020. The virus is now called the Tokyo type. We have subtracted the accumulated number 20507 on July 19 of removed in the first wave from that in the first and second waves.
Date t and the removed number R(t) in the second wave in Japan.
Substituting data stated above into Eq. (2.10) with n=1, we have the equation for d
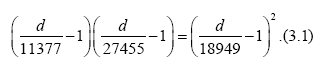
to yield a solution
d=45071, (3.2)
From Eq. (2.7) with n=1 we get
with F1 ≡ F(t1) and F2 ≡ F(t2). 
Substituting the result ac=0.1092 into Eq. (2.6), we have
ac (T-t3)=1nF3=1n0.6417=-0.4436.(3.4)
with F3 ≡ F(t3) to yield to yield T−t3=−4.062, so that
T = t3 −4.062= Aug.21 − 4.062 = Aug.17.(3.5)
Error estimations for d and T can be seen from Appendix. By using relative errors.,
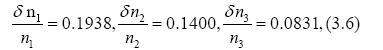
we have
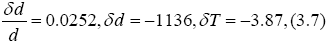
so that
d 45071 1136, 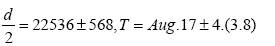
The value of d=45071 on Aug.17 is plotted in Figure 1. Values of d for the other n are also plotted in Figure 1. In Figure 2 we draw a red curve of Eq. (2.5) for R(t) calculated with the average value d=44465 and ac=0.1106 from Aug 13 to Aug 20, while the blue curve shows data for R(t). Both lines coincide well in a region before Aug.27. The value of d should be constant as seen between Aug. 13 and Aug.20 within errors 1200~5000, but not before Aug.12. The deviation comes from the deviation between the red line and blue line in Figure 2, where the red line is the calculated one of R(t) and the blue line is its data. From this reason we abandon data outside of Aug.13~20.

Figure 1: Blue points show values of d, which is defined by d=R(∞), e. g., the final total removed number, and is a solution of Eq. (2.10) for each n.

Figure 2: The red line is a calculated curve of R(t), while the blue line shows data for R(t). Both lines coincide well in a region before Aug. 27.

Figure 3: The blue line shows the calculated line of R(t). The red line is the infectious number I(t) with d=4465 and a=2.698.
To sum up, the second wave started from July.20, 2020, and peaked at August17 with its total removed number 22536 ± 568. These calculated values should be compared with actual data that the peak date is around Aug.17 with its total removed number 22460.
Application to the third wave of COVID-19 in Japan
Our logistic formula is applied to the third wave of COVID-19 in Japan. This provides a revise of previous work [13]
Date and the removed number in the third wave in Japan.
The R(t) is the accumulated number of removed in the third wave in Japan, which is an average for 7 days in a middle at each t with standard deviations, where t is the date starting from Oct. 11. We have subtracted the accumulated number 82810 of removed in the first and second waves from that in the first, second and third waves.
Substituting data above into Eq. (2.10) with n=1, we have the equation for d
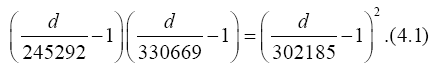 to yield a solution
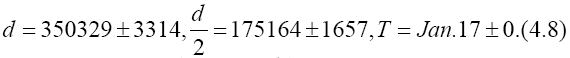
d=350329, (4.2)
From Eq. (2.7) with n=1 we get
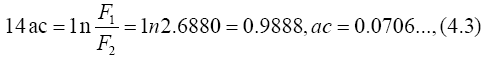
Substituting the result ac=0.0701 into Eq. (2.6), we have
ac(T-t3) 1nF3 1n0.0591=-2.8218.(4.4)
to yield to yield T − t3=−39.97, so that
T=t3-39.97= Feb .26 − 39.97 = Jun.17.(4.5)
Error estimations for d and T can be seen from Appendix. By using relative errors.,
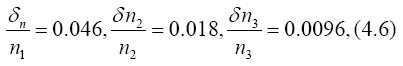
we have
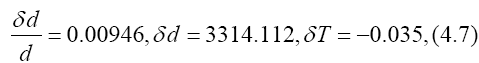
so that
The value of d=350329 on Feb. 12 is plotted in Figure 4. Values of d for the other n are also plotted in Figure 4.

Figure 4: Blue points show values of d, which is defined by d=R(∞), e. g., the final total removed number, and is a solution of Eq. (2.10) for each n.
to March 15, while the blue curve shows data for R(t). Both lines coincide well in a region after Jan. 19. The value of d should be constant as seen after Jan. 24, but not before Jan. 24. The deviation comes from the deviation between the red line and blue line before Jan. 24 in Figure 5, where the red line is the calculated one of R(t) and the blue line is its data. From this reason we abandon data before Jan.24. To sum up, the third wave started from Oct.11, 2020, and peaked at Jan. 17 with its total removed number 175165 ± 1657. These calculated values should be compared with actual data that the peak date is around Jan. 17 with its total removed number 177501.

Figure 5: The red line is a calculated curve of R(t), while the blue line shows data for R(t). Both lines coincide well in a region after Jan. 24.

Figure 6: The blue line shows the calculated line of R(t). The red line is the infectious number I(t) with d=348008 and a=1.763.
The logistic formula in biology is applied, as the first principle, to analyze the removed number by the second and third waves of COVID-19 in Japan. The second wave started from July.20, 2020, and peaked at Aug.17 with its total removed number 22536 ± 568. These calculated values should be compared with actual data that the peak date is around Aug.17 with its total removed number 22460. The third wave started from Oct.11, 2020, and peaked at Jan. 17 with its total removed 6number 175165 ± 1657. These calculated values should be compared with actual data that the peak date is around Jan. 17 with its total removed number 177501. Results of the third wave have been obtained by using new data after the peak, Jan. 17. So, these are not a kind of prediction. However, we have succeeded to reproduce the peak data fairly well.
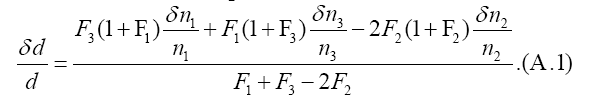
From the formula F1F3=F22 he relative error of removed number d is driven as
Secondly, the equation for the peak day T, ac(T − t3)=ln F3, yields a formula
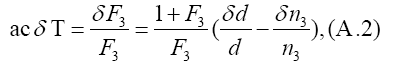
from which one can estimate δT.
We would like to thank K. Shigemoto for many valuable discussions and big supports.