Research & Reviews: Journal of Pure and Applied Physics
ISSN: 2320-2459
ISSN: 2320-2459
Department of Physics, Faculty of Science, COMSATS Institute of Information Technology, Pakistan
Received Date: 21/01/2018; Accepted Date: 14/03/2018; Published Date: 23/03/2018
Visit for more related articles at Research & Reviews: Journal of Pure and Applied Physics
Rainfall is the primary and most important component of any hydrological event. There is some amount of uncertainty in the future prediction of rainfall. The purpose of using SCL is the quantification of uncertainty involved in the prediction of rainfall. In the last few decades a considerable variation in the rainfall of the northern Pakistan has occurred. This might be due to the increase in temperature which is going to be threat for the water resources of Pakistan. So there is need to estimate the uncertainties involved in the estimation of the rainfall. In this paper an effort is being carried out to quantify the uncertainties in the average monthly rainfall for UIB using SCL (Stochastic Climate Library). In this paper an effort is being done to quantify the uncertainty involved in the average monthly rainfall data of rain gauge in Astor. Using the SCL the stochastic data is generated based upon the previous average monthly rainfall data of Astor from (1954 to 2000). Several statistics (annual and monthly) are computed to determine the behavior of the model and to compare them with the stochastic data produced.
Environment, Regeneration, Agriculture, Hydrology
Monthly rainfall data plays a key role in the estimation of runoff generated from large catchment and also to simulate the water resources of any country which is the backbone of the economy. In order to determine how a system will behave against the variation in the climate long data records of stochastically generated data are used.
Precipitation is vital in the climate variations. Srikanthan and Pegram [1] described an increasing trend in the precipitation to 1% from 0.5% in the elevated areas of the northern Pakistan. This increase has been observed in every decade of the 20th century. The statistically insignificance trend in the rainfall all over the world as well as for Himalayas being studied by many researchers in the last century.
Average monthly precipitation data is required to simulate the monthly flows which are main component of runoff produced from large catchments. But these models have a drawback that these models do not work well for the catchments which have considerable number of dry months. McMahon and Srikanthan [1] described the method of fragments to separate the annual rainfall data into its constituents by using the AR model of order 1. The limitation of this method is the inability that it cannot preserve the correlation (monthly) between the 1st month of a year and previous month of last year and also the same patterns for shorter length of data records.
Using stream flows Perera and Maheepala [2] made few changes in the method of fragments that take care of the first limitation of preserves of the monthly correlation. For the second limitation they have used the Thomas-Fiering monthly (stream flow) model. But it becomes troublesome for the sites having considerable number of months having no rainfall.
O’Neill and Sharma [3] used nonparametric method to model the inter annual effects in monthly runoff.
Climate Variability Program in the Cooperative Research Centre (CRC) for Catchment Hydrology has developed and tested many computer programs for generating stochastic climate data at time scales from less than one hour to one year and for point sites to large catchments. The appropriate models are part Stochastic Climate Library. In this research paper the development and testing of annual and monthly data of Astore (Pakistan) station has been studied. Stochastic monthly data can be further used for hydrological modelling and to quantify the uncertainties in the environmental system. A first order Markov chain is used which consist of two parts one is to model the occurrence of rainfall and second is to find the depth of occurrence. A two parameter Gamma distribution is used with correlated random numbers to obtain the rainfall depths. Historical and generated statistic shows that the model preserves the important characteristics of monthly and annual rainfall. Bardossy et al. [4] have studied time series of circulation patterns which are modelled with the help of a semi-Markov field and Rainfall is linked to the circulation patterns using conditional probabilities. Bardossy et al. [4] estimated the parameters method based on the moments of the observed data are developed.
In the last few decades a considerable variation in the rainfall of the northern Pakistan have occurred [5]. This might be due to the increase in temperature which is going to be threat for the water resources of Pakistan. So there is need to estimate the uncertainties involved in the estimation of the rainfall. In this paper an effort is being carried out to quantify the uncertainties in the average monthly rainfall for UIB using SCL (Stochastic Climate Library).
In this study Astore watershed is selected to determine the uncertainty in the prediction of rainfall [6]. The Astore watershed is located in Pakistan having longitude and latitude 35° 33’ and 74° 42’ respectively, having a catchment area of about 3990 km2 Figure 1. There is only one gauging station installed by Pakistan Metrological Department having an elevation of 2168 m.a.s.l.

Figure 1: Astore Water Shed.
A store watershed is an elevated area having peak elevation of about 8000 m.a.s.l. in winter it is mostly covered with snow and glaciers. About 15% of the total area is covered with snow [7,8].
MMF (Modified Method of Fragments) and AR (1) Model
The historical data of average monthly rainfall is standardized yearly in such a way that sum of average monthly precipitation for any year is one [9,10]. This can be done by dividing the average monthly rainfall by respective annual precipitation. In this way by having the record of k years one can produce the k sets of fragments of average monthly rainfall.
The appropriate number of monthly fragments for a particular year, n, is obtained by taking in account how close the produced yearly rainfall data and the monthly precipitation data for the last month of previous year to the corresponding observed data [2] (Figure 2). It is done by having of the appropriate number of the monthly fragment of a year, z, in the produced monthly data series that will develop a minimum value αz, that is given here:

Figure 2: Historical and Stimulated data of Rainfall in terms of Mean, Standard deviation, skewness, lag one auto-correlation, maximum and minimum.
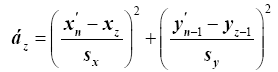
 : Produced annual rainfall for year n
xz : Observed annual rainfall for year n
sx : st. dev of the annual precipitation
 : Observed monthly precipitation for the last month of the year n-1
yz-1: Observed monthly precipitation for the last month of the year z-1
sy= st. dev of the monthly rainfall for the last month of the year
The annual rainfall is generated by Autoregressive model of order 1 (AR (1)).
Monthly Parameters
The average values of the mean, std. dev, skewness, lag one autocorrelation max, min and percentage zero rain for the 100 replicates are compared with the historical values and are shown from Tables 1-7.
Table 1. Comparison between Historical and Generated monthly mean rainfall.
| Item | Hist. | Mean | 2.50% | 25% | 50% | 75% | 97.50% | Tol. | Y/N |
|---|---|---|---|---|---|---|---|---|---|
| Jan | 43.349 | 38.871 | 28.571 | 35.676 | 38.536 | 42.201 | 47.148 | 7.50% | N |
| Feb | 48.677 | 43.645 | 35.759 | 41.085 | 43.785 | 46.771 | 52.36 | 7.50% | N |
| Mar | 88.632 | 91.138 | 72.932 | 82.783 | 89.691 | 98.238 | 120.49 | 7.50% | Y |
| Apr | 89.609 | 89.4 | 74.925 | 81.03 | 88.581 | 95.362 | 110.684 | 7.50% | Y |
| May | 76.823 | 81.489 | 63.354 | 74.763 | 81.302 | 88.013 | 97.98 | 7.50% | Y |
| Jun | 24.323 | 24.767 | 18.859 | 22.469 | 24.467 | 27.081 | 32.769 | 7.50% | Y |
| Jul | 24.349 | 25.069 | 18.98 | 22.587 | 24.93 | 27.418 | 32.312 | 7.50% | Y |
| Aug | 25.687 | 27.875 | 20.833 | 25.208 | 27.485 | 30.169 | 35.959 | 7.50% | N |
| Sep | 21.106 | 20.229 | 14.412 | 17.354 | 19.479 | 22.604 | 30.058 | 7.50% | Y |
| Oct | 28.731 | 32.639 | 21.829 | 27.996 | 32.282 | 36.489 | 45.568 | 7.50% | N |
| Nov | 21.188 | 21.14 | 15.97 | 18.314 | 20.876 | 23.369 | 27.607 | 7.50% | Y |
| Dec | 29.974 | 29.917 | 22.483 | 27.261 | 29.433 | 32.616 | 37.844 | 7.50% | Y |
Table 2. Comparison between Historical and Generated monthly mean rainfall Standard Deviation.
| Item | Hist. | Mean | 2.50% | 25% | 50% | 75% | 97.50% | Tol. | Y/N |
|---|---|---|---|---|---|---|---|---|---|
| Jan | 30.13 | 29.49 | 20.39 | 26.669 | 29.208 | 31.96 | 38.569 | 7.50% | Y |
| Feb | 29.692 | 29.881 | 24.433 | 27.009 | 30.067 | 32.583 | 36.797 | 7.50% | Y |
| Mar | 57.134 | 61.978 | 44.357 | 55.788 | 63.38 | 67.087 | 83.297 | 7.50% | N |
| Apr | 53.213 | 53.854 | 45.017 | 49.409 | 53.754 | 58.348 | 63.438 | 7.50% | Y |
| May | 59.619 | 61.62 | 44.622 | 57.155 | 61.56 | 65.61 | 77.15 | 7.50% | Y |
| Jun | 19.899 | 19.774 | 13.698 | 15.887 | 19.245 | 22.47 | 29.536 | 7.50% | Y |
| Jul | 22.796 | 21.107 | 12.474 | 18.336 | 21.516 | 23.508 | 30.671 | 7.50% | Y |
| Aug | 22.993 | 24.207 | 15.2 | 21.493 | 23.942 | 27.107 | 32.805 | 7.50% | Y |
| Sep | 26.595 | 22.449 | 9.647 | 13.06 | 25.13 | 27.257 | 40.771 | 7.50% | N |
| Oct | 33.02 | 38.068 | 20.373 | 33.062 | 38.402 | 43.957 | 51.624 | 7.50% | N |
| Nov | 23.678 | 22.293 | 15.644 | 20.169 | 22.412 | 25.1 | 28.712 | 7.50% | Y |
| Dec | 31.051 | 28.644 | 21.362 | 25.299 | 28.389 | 31.293 | 40.631 | 7.50% | N |
Table 3. Comparison between Historical and Generated monthly mean rainfall Skewness.
| Item | Hist. | Mean | 2.50% | 25% | 50% | 75% | 97.50% | Tol. | Y/N |
|---|---|---|---|---|---|---|---|---|---|
| Jan | -0.139 | -0.022 | -0.21 | -0.1 | -0.031 | 0.058 | 0.197 | ±0.2 | Y |
| Feb | -0.024 | 0.008 | -0.194 | -0.055 | 0.008 | 0.075 | 0.208 | ±0.2 | Y |
| Mar | -0.06 | -0.057 | -0.342 | -0.145 | -0.057 | 0.04 | 0.232 | ±0.2 | Y |
| Apr | -0.045 | -0.072 | -0.339 | -0.204 | -0.083 | 0.045 | 0.294 | ±0.2 | Y |
| May | 0.002 | 0.104 | -0.119 | 0.007 | 0.104 | 0.167 | 0.364 | ±0.2 | Y |
| Jun | -0.072 | 0.011 | -0.285 | -0.166 | -0.001 | 0.145 | 0.395 | ±0.2 | Y |
| Jul | -0.064 | -0.059 | -0.203 | -0.147 | -0.091 | -0.008 | 0.23 | ±0.2 | Y |
| Aug | -0.105 | 0.021 | -0.271 | -0.088 | 0.004 | 0.113 | 0.384 | ±0.2 | Y |
| Sep | 0.068 | 0.018 | -0.201 | -0.104 | -0.008 | 0.117 | 0.362 | ±0.2 | Y |
| Oct | -0.116 | -0.084 | -0.275 | -0.162 | -0.108 | -0.036 | 0.194 | ±0.2 | Y |
| Nov | 0.07 | 0.086 | -0.129 | 0.004 | 0.081 | 0.143 | 0.346 | ±0.2 | Y |
| Dec | -0.029 | 0.014 | -0.241 | -0.107 | 0.002 | 0.116 | 0.327 | ±0.2 | Y |
Table 4. Comparison between Historical and Generated monthly mean rainfall lag one autocorrelation.
| Item | Hist. | Mean | 2.50% | 25% | 50% | 75% | 97.50% | Tol. | Y/N |
|---|---|---|---|---|---|---|---|---|---|
| Jan | 143.1 | 134.947 | 77.592 | 130.665 | 140.257 | 144.96 | 150.074 | 10% | Y |
| Feb | 144.4 | 126.583 | 87 | 91.899 | 140.859 | 151.325 | 157.418 | 10% | N |
| Mar | 239.8 | 253.6 | 222.516 | 245.346 | 252.145 | 256.373 | 299.613 | 10% | Y |
| Apr | 221.2 | 210.554 | 168.11 | 190.149 | 217.351 | 228.006 | 241.5 | 10% | Y |
| May | 248.7 | 246.539 | 205.652 | 233.352 | 240.523 | 255.409 | 311.121 | 10% | Y |
| Jun | 94.1 | 87.641 | 47.582 | 56.994 | 93.719 | 102.147 | 133.051 | 10% | Y |
| Jul | 116.3 | 101.828 | 49.557 | 88.542 | 107.286 | 117.702 | 145.49 | 10% | N |
| Aug | 106.6 | 104.477 | 62.156 | 105.129 | 107.78 | 109.351 | 112.368 | 10% | Y |
| Sep | 172.3 | 121.793 | 47.445 | 55.575 | 168.877 | 174.539 | 180.697 | 10% | N |
| Oct | 170.6 | 171.305 | 93.849 | 172.43 | 184.684 | 191.094 | 198.838 | 10% | Y |
| Nov | 110 | 99.698 | 70.548 | 81.182 | 109.537 | 112.169 | 114.77 | 10% | Y |
| Dec | 168.1 | 128.26 | 81.035 | 96.23 | 128.854 | 164.077 | 171.866 | 10% | N |
Table 5. Comparison between Historical and Generated monthly rainfall maximum.
| Item | Hist. | Mean | 2.50% | 25% | 50% | 75% | 97.50% | Tol. | Y/N |
|---|---|---|---|---|---|---|---|---|---|
| Jan | 2.3 | 2.635 | 0.91 | 1.983 | 2.196 | 3.294 | 6.867 | 10% | N |
| Feb | 4.2 | 4.103 | 3.821 | 3.95 | 4.078 | 4.176 | 5.011 | 10% | Y |
| Mar | 9.7 | 10.961 | 2.48 | 8.059 | 9.092 | 11.446 | 23.959 | 10% | N |
| Apr | 1.3 | 4.218 | 1.281 | 1.299 | 1.326 | 2.981 | 21.431 | 10% | N |
| May | 4.5 | 6.14 | 3.195 | 4.3 | 4.43 | 4.611 | 14.355 | 10% | N |
| Jun | 2 | 2.119 | 1.42 | 1.966 | 2.036 | 2.275 | 2.863 | 10% | Y |
| Jul | 0.3 | 0.475 | 0.262 | 0.272 | 0.294 | 0.795 | 0.999 | 10% | N |
| Aug | 2.2 | 2.535 | 1.703 | 2.107 | 2.242 | 3.206 | 4.355 | 10% | N |
| Sep | 0.8 | 1.267 | 0.754 | 0.778 | 0.799 | 2.224 | 3.108 | 10% | N |
| Oct | 0.3 | 0.865 | 0.272 | 0.284 | 0.3 | 1.394 | 2.56 | 10% | N |
| Nov | 0.3 | 0.378 | 0.287 | 0.293 | 0.3 | 0.313 | 1.315 | 10% | N |
| Dec | 0.8 | 1.047 | 0.725 | 0.782 | 0.816 | 1.213 | 1.867 | 10% | N |
Table 6a. Comparison between Historical and Generated monthly rainfall minimum.
| Item | Hist. | Mean | 2.50% | 25% | 50% | 75% | 97.50% | Tol. | Y/N |
|---|---|---|---|---|---|---|---|---|---|
| Jan | 0 | 0 | 0 | 0 | 0 | 0 | 0 | ±5 | Y |
| Feb | 0 | 0 | 0 | 0 | 0 | 0 | 0 | ±5 | Y |
| Mar | 0 | 0 | 0 | 0 | 0 | 0 | 0 | ±5 | Y |
| Apr | 0 | 0 | 0 | 0 | 0 | 0 | 0 | ±5 | Y |
| May | 0 | 0 | 0 | 0 | 0 | 0 | 0 | ±5 | Y |
| Jun | 0 | 0 | 0 | 0 | 0 | 0 | 0 | ±5 | Y |
| Jul | 0 | 0 | 0 | 0 | 0 | 0 | 0 | ±5 | Y |
| Aug | 0 | 0 | 0 | 0 | 0 | 0 | 0 | ±5 | Y |
| Sep | 0 | 0 | 0 | 0 | 0 | 0 | 0 | ±5 | Y |
| Oct | 0 | 0 | 0 | 0 | 0 | 0 | 0 | ±5 | Y |
| Nov | 0 | 0 | 0 | 0 | 0 | 0 | 0 | ±5 | Y |
| Dec | 0 | 0 | 0 | 0 | 0 | 0 | 0 | ±5 | Y |
Table 6b. Comparison between Historical and Generated monthly rainfall% no rain.
| Item | Hist. | Mean | 2.50% | 25% | 50% | 75% | 97.50% | Tol. | Y/N |
|---|---|---|---|---|---|---|---|---|---|
| Jan | 0 | 0 | 0 | 0 | 0 | 0 | 0 | ±5 | Y |
| Feb | 0 | 0 | 0 | 0 | 0 | 0 | 0 | ±5 | Y |
| Mar | 0 | 0 | 0 | 0 | 0 | 0 | 0 | ±5 | Y |
| Apr | 0 | 0 | 0 | 0 | 0 | 0 | 0 | ±5 | Y |
| May | 0 | 0 | 0 | 0 | 0 | 0 | 0 | ±5 | Y |
| Jun | 0 | 0 | 0 | 0 | 0 | 0 | 0 | ±5 | Y |
| Jul | 0 | 0 | 0 | 0 | 0 | 0 | 0 | ±5 | Y |
| Aug | 0 | 0 | 0 | 0 | 0 | 0 | 0 | ±5 | Y |
| Sep | 0 | 0 | 0 | 0 | 0 | 0 | 0 | ±5 | Y |
| Oct | 0 | 0 | 0 | 0 | 0 | 0 | 0 | ±5 | Y |
| Nov | 0 | 0 | 0 | 0 | 0 | 0 | 0 | ±5 | Y |
| Dec | 0 | 0 | 0 | 0 | 0 | 0 | 0 | ±5 | Y |
Table 7. Comparison between Historical and Generated monthly rainfall Statistics.
| Statistics | Hist. | Mean | 2.50% | 25% | 50% | 75% | 97.50% | Tol. | Y/N |
|---|---|---|---|---|---|---|---|---|---|
| Rainfall mean | 522.448 | 526.179 | 469.49 | 506.27 | 522.248 | 544.539 | 596.525 | 5% | Y |
| Rainfall St.dev | 130.623 | 139.548 | 93.109 | 121.293 | 138.622 | 154.408 | 196.575 | 5% | N |
| Rainfall Skewness | 0.378 | 0.363 | -0.539 | -0.059 | 0.284 | 0.661 | 1.766 | ±0.5 | Y |
| Rainfall lag oneautocorrelation | -0.075 | -0.069 | -0.464 | -0.18 | -0.058 | 0.048 | 0.277 | ±0.15 | Y |
| Rainfall max | 1.642 | 1.685 | 1.362 | 1.543 | 1.629 | 1.755 | 2.297 | 10% | Y |
| Rainfall min | 0.538 | 0.467 | 0.092 | 0.384 | 0.494 | 0.575 | 0.687 | 10% | N |
| Two year low rainfall | 1.42 | 1.24 | 0.582 | 1.131 | 1.299 | 1.393 | 1.567 | 10% | N |
| Three year low rainfall | 2.322 | 2.108 | 1.37 | 1.986 | 2.183 | 2.299 | 2.514 | 10% | Y |
| Five year low rainfall | 4.157 | 3.937 | 2.967 | 3.775 | 3.984 | 4.159 | 4.493 | 10% | Y |
| Seven year low rainfall | 6.1 | 5.816 | 4.822 | 5.574 | 5.871 | 6.062 | 6.455 | 10% | Y |
| Ten year low rainfall | 8.756 | 8.707 | 7.742 | 8.45 | 8.784 | 8.988 | 9.378 | 10% | Y |
Annual Parameters
The mean values of average, standard deviation, skewness, lag one auto correlations, max, min and two, three, five, seven and ten years low rainfall from 100 replicates are shown in the Table 7.
The main concern of the stochastic rainfall generation is rainfall depth and its occurrence. In this study a stochastic rainfall generation model for the average monthly rainfall is made for Astor. The monthly rainfall model can be applicable in the detailed water budget and environmental and agricultural model studies. The average monthly precipitation data from 1954 to 2000 was made for Astor. The model’s monthly and annual parameter is estimated using SCL (stochastic climate library). The Root mean square values calculated for average of the 100 monthly replicates shows fairly good results. The average values of % no rain for all the 100 replicates have zero values which shows that no month from the year 1954 to 2000 have zero rainfall for the Astor, whereas the historical data shows some month from 1954 to 2000 having zero average monthly rainfall. So on the basis of the comparison for the % no rain we can say that model is over estimating the % occurrence of no rain.