Research & Reviews: Journal of Pure and Applied Physics
ISSN: 2320-2459
ISSN: 2320-2459
Habibeh Ghasemi1, Zohreh Azma2, Ali Jabbary Arfaee3 and Mahdi Sadeghi4*
1Medical Radiation Engineering Department, Science and Research Branch, Tehran, Iran
2Medical Radiation Engineering Department, Shahid Beheshti University, Tehran, Iran
3Shohada Tajrish Hospital Radiation Oncology, Shahid Beheshti University, Tehran, Iran
4Medical Physics Department, School of Medicine, Iran University of Medical Science, Tehran, Iran
Received Date: 10/07/2018; Accepted Date: 26/09/2018; Published Date: 04/10/2018
Visit for more related articles at Research & Reviews: Journal of Pure and Applied Physics
Background: In the treatment with the electron beams to get the appropriate dose distribution in the tumor region, the distance between virtual electron source position and patient’s body should be correctly identified. This study is an attempt to find the effective SSD (Source-surface distance)by using the Monte Carlo N-particle (MCNP v1. 51) code to substitute the measurements in the clinic. Materials and Methods: The MC (Monte Carlo) simulation of Oncor Linac (Siemens Co. Germany) was done based on manufacturer data in 9 MeV electron beam energy. In order to obtain the values of effective SSD using the inverse slope (IS) technique, point doses are calculated at dmax (the depth of maximum dose on the central axis), inside of the water phantom model, with the phantom simulated first at the standard SSD (5 cm air gap) and then with an increasing air gap of 3, 6, 9 and 12 cm between the distal end of applicator and the phantom surface. Results: The measured and MC-calculated effective SSDs using IS method are presented and compared with those reported from other works. The effective SSDs were found to be 95.68 cm and 96.66 cm from the MC tallies of *F8 and *F4, respectively. In addition, the effective SSDs were found to be 95.59 cm from ion chamber measurement. Conclusion: Considering the results from three methods of calculation, and comparing the results with experimental methods, it was shown that Monte Carlo simulation is a useful method in determination of electron virtual source position.
Electron beams have an important role in the treatment of superficial and shallow cancers in modern radiotherapy [1]. Because of the electron interactions with the accelerator head materials including scattering foils, monitoring chambers, photon jaws, and the applicators, they may be thought of as emanating from the virtual source that is not in the real position of the accelerator exit window. The International Commission on Radiation Units and Measurements (ICRU) Report No. 35 [2], defines an effective extended electron source as the source which when placed in a vacuum at some distance SSD from the phantom surface (Z=0) would produce exactly the same electron fluence at Z=0 as the actual beam. The distance from this source position to the patient’s skin surface is called the effective SSD. To obtain an accurate dose calculation of electron beams, correction for measured effective SSD must be applied. In addition, effective SSD may be used to calculate output at extended SSD for corrections of central axis percentage depth dose (PDD) [3], off-axis dose (OAD) values, output factors, and X-ray contamination [4]. Hence, it is essential that these corrections should be examined for each treatment unit prior to referral to treat at extended SSD using electron beams. The SSDeff is dependent on the electron energy and the field size used.
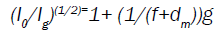
There are three independent experimental techniques to ascertain the position of the effective electron source. These are projection of the wires grid image to a photographic film, variation of field size with the nominal source-to-film distance, and variation of dose rate with the distance [5-7]. The last method, namely the ‘inverse slope’ proposed by Khan [8,9] was chosen in the present work since it simulates the situation in which we need to know the dose rate from the electron beam output of a Siemens Oncor Linac machine (Siemens Co. Germany) at different extended SSD. Khan et al. [10] have recommended an inverse slope (IS) method that simulates as closely as possible the clinical circumstance. In this regard, by taking:
 (1)
(1)
Which g is the air gap between the distal end of the applicator and the surface of the water phantom, f is the effective SSD value, I0 is dose at dmax with no air gap, and Ig depicts the dose value with air gap. By plotting (I0/Ig) (1/2) as a function of gap g, a straight line is obtained. The slope of this line is the reciprocal of the (f+dm). Hence, the effective SSD is given by:
f=(1/slope) – dm (2)
Herein, we attempted to estimate the effective electron source position using measurements and Monte Carlo simulation from a Siemens Oncor LINAC at the Alborz Hospital (Karaj, Iran).
Measurement
In the current work, to verification of the simulated beam's dosimetric properties, the PDD along clinical axis data and the OAD values both were measured within a 50 × 50 × 50 cm3 PTW scanning water phantom tank (MP3-m, PTW) according to recommendations of the Technical Reports series No. 398 protocol, reported by International Atomic Energy Agency (IAEA) [11]. Measurements were performed along the central axis by using a 0.02 cc nominal sensitive volume Advanced Markus® electron chamber (TM 34045; PTW, Freiburg, Germany) and acquired data were processed using the MEPHYSTO (Medical Physics Tools) mc2 software v7.20 (PTW-beam analyzer) at the Alborz Hospital (Karaj, Iran). The Advanced Markus chamber is a vented parallel plate with an approximate moving speed of 50 mm/sec and had a 0.87 mm thick PMMA (Poly Methyl Meth Acrylate) protective cap for in-water measurements. Chamber positions inside the phantom were automatically controlled using a TBA control unit (PTW). The PDD step sizes were 2 mm, 5 mm and 10 mm for depths shallower than 3 cm, 4 cm and 8 cm, respectively. The profile step sizes were set to 2 mm in the penumbra and 5mm everywhere else.
In order to obtain the values of effective SSD, point doses are measured by radiating 100 monitor unit (MU) at near the depth of maximum dose, dmax (i.e. 2.4 cm) inside of the water phantom, with the phantom first at the standard SSD (no air gap) and then with an increasing air gap of 3, 6, 9 and 12 cm between the distal end of applicator and the phantom surface. Although the effective SSD is acquired through doing measurements at the dmax, its value does not change considerably with the depth of measurement [10]. This procedure was carried out for electron beam energy of 9 MeV using applicator sizes of 10 × 10 cm2. The uncertainty in the measurement of dose values is obtained less than 2%.
Monte Carlo Simulation
In this work, the MCNP5 v1.51 Monte Carlo code [12-18] was employed to simulate the radiation transport of electron beams through the Siemens ONCOR Linac (Siemens Co. Germany) treatment head and water phantom based on the dimensions and materials provided by the manufacturer. The accelerator exit window, primary collimators, flattening filter, monitor chambers, Y-jaws, and X-jaws were simulated in the geometric section of the code. The electron source was simulated with a 0.1 mm radius in disk form, which produced 9 MeV electron beams and had a Gaussian energy distribution with a full width at half maximum (FWHM) of 1.007 MeV and centered at 10.06 MeV for the 9 MeV electron beam. A view of simulated geometry for the treatment head of Siemens Oncor LINAC is shown in Figure 1.
Dose Calculations
The percentage depth dose along central axis and off-axis dose values acquired in a water phantom with dimensions of 50 × 50 × 50 cm3 with an SSD of 100 cm. Since no mesh tally is available for pulse height tally *F8 with full physics transport (p, e-mode) in the MCNP5 code, a three dimension (3D) tally distribution of cells were applied in the simulation. To achieve depth dose calculations within various depths of the water phantom, a narrow rectangle region was defined with 5 mm lateral width and 160 mm height along the beam central axis. The narrow rectangle was then split into tiny scoring voxels with size varied between 5.0 × 5.0 × 1.0 and 5.0 × 5.0 × 7.0, depending on the spatial resolution required. Usually, a smaller voxel size was chosen for the depth dose buildup region and the beam penumbra region [19]. Applying the same procedure was followed to calculate transverse dose values, except that the main axes of scoring narrow rectangle was considered perpendicular to the central axis of the beam. To plot PDD and OAD curves, all absorbed dose values were normalized to the maximum dose in dmax. In the simulations for PDD and OAD calculations, the cut-off energy value was defined as 0.01 and 0.05 MeV for the photons and electrons, respectively. A total number of 1 × 10⁹ initial histories of electron source were tracked in the MCNP5 input. The maximum combined Monte Carlo statistical uncertainty in PDD and OAD calculations was equal to 5% and 6%, respectively.
In order to obtain the values of effective SSD, point doses are calculated at dmax, inside of the 50 × 50 × 50 cm3 water phantom model, with the phantom simulated first at the standard SSD (5 cm air gap) and then with an increasing air gap of 3, 6, 9 and 12 cm between the distal end of applicator and the phantom surface. A cylindrical region with 2.5 mm radius and 1 mm height centered at dmax to represent the detector used for measurements, identical to the nominal sensitive volume of Advanced Markus® electron chamber. For these voxels, the *F8 pulse height tally and the *F4 mean fluence of particles in a cell volume are defined in the Monte Carlo geometry description, which the last one scores the energy fluence and could be converted to the absorbed dose by multiplication this value with the mass energy absorption coefficients for the water, liquid extracted from the NIST database [20]. The statistical uncertainty in the calculation of dose values is obtained less than 2.04% and 1.8% from *F8 and *F4 tallies, respectively. To verify our simulation data, we have compared our Monte Carlo results with the corresponding measured values.
Depth Dose Distribution and Dose Profile
To validate our simulation results, the MC-calculated PDD and OAD values in a water phantom were firstly obtained for a 9-MeV electron beam using open 10 × 10 cm2 applicator from Siemens ONCOR Linac and then compared with the experimental data measured at the Alborz Hospital, Karaj, Iran. Figures 2 and 3 illustrate the compare of experimental versus MC-based theoretical relative depth dose curves from 9-MeV electron beams for the field size of 10 × 10 cm2 in water. As it can be seen from Figure 2 the MC-calculated PDD overestimates the dose in the buildup region with local differences up to 4.5%. The larger deviation in the build-up region is due to a high gradient of dose distribution, which makes ionization chamber measurements unreliable as well as the waterproof enclosure of the chamber, which affects the PDD at the surface of the phantom [21]. Also, the finite size of the chamber, which perturbs the absorbed dose, may be another reason [22]. Beyond dmax, differences are less than 1% from R100 (depth of dose maximum) to Rp (practical range of an electron beam) and up to 1.7% in the bremsstrahlung tail region. The measured R50 and RP were 4.0 and 5.1 cm, and for MC-calculation were 3.9 and 5.25 cm, respectively. The differences in R50 and Rp between these curves are less than 0.2 and 0.15 cm, respectively. The relative statistical errors on the MC results were less than 2% for depths smaller than R50 and reach a maximum of 5% for larger depths.
Off-axis dose values were determined at the depths of dmax within the water phantom. The measured and calculated profiles for 9-MeV electron beams are presented in Figure 4. The relative statistical errors on the MC results were less than 2% for dose fall-off region and reach a maximum of 6% outside the radiation field. As Figure 5 depicts, the agreement between measurement and MC calculations was within 1.7% for plateau region, but it increased to 4.6% for the region located outside the radiation field, which can be ensure deviation limits [23,24]. These differences occurred because the effects of electronic components and the lead blocks shielding the target, the monitor chamber, and the jaw inside the treatment head were negligible and not included in the design drawing. The design drawing of the electron applicators does not describe an accurate width or thickness of each scraper in detail, although the thickness of each scraper is given. The error in the thickness measured using a digital caliper affected the results calculated outside the applicator [25]. The precision of the caliper measurements was about 1 mm. The Figure 5 exhibits a difference of less than 0.6 mm for 80-20% penumbra width between measured and MC calculated results. Tables 1 and 2 summarize the differences between the measured and the calculated dose in PDD and profiles, respectively.
Table 1. Differences for measured and calculated percentage depth dose.
| Energy (MeV) | Differences up to dmax (%) | Differences at dmax (mm) | Differences at R50 (mm) | Differences at Rp (mm) |
|---|---|---|---|---|
| 9 | 1.95 | 0.5 | 1 | 1.5 |
Table 2. Differences for measured and calculated off-axis dose values.
| Energy (MeV) | Differences at plateau area (%) | Differences at D50 (mm) | Differences a bremsstrahlung tail (%) |
|---|---|---|---|
| 9 | 1.7 | 0.7 | 3.07 |
The Effective SSD
To find the effective source position, measurement and calculations were carried out at various SSD values ranging from 100 to 112 cm for a radiation field of 10 × 10 cm2 at 9-MeV electron beam energy. The inverse slope (IS) technique was used to find the effective SSD as recommended by Khan et al. [26]. For clinical requirements, the IS technique is recommended, because it is more clinically related as well as give accurate inverse-square corrections [26]. For instance, the usage of IS technique is shown in Figure 6. It can be seen that the graphs were drawn by indicating the extended SSDs on the z-axis, and square-root value of I0/Ig at the dmax on the y-axis using the results shown in Table 3. The slope of the resulting straight lines is obtained and the effective SSDs were determined using Equation 2 [27-30]. The measured and MC-calculated effective SSDs using IS method are shown in Table 3. From the MC results, the effective SSDs were found to be 95.68 cm and 96.66 cm from tallies of *F8 and *F4, respectively. There are small deviations between both MC results. In addition, the effective SSDs were found to be 95.59 cm from ion chamber measurement.
Table 3. Comparison of calculated and measured extended source-to-surface distance (SSD) factors.
| SSD (cm) | Measured† | Calculated (*F8) | Calculated (*F4) | Uncertainty, *F8 (%) | Uncertainty, *F4 (%) |
|---|---|---|---|---|---|
| 100 | 651 | 1.418e-14 | 8.605e-5 | 1.8 | 1.5 |
| 103 | 615.33 | 1.325e-14 | 8.31e-5 | 2 | 1.8 |
| 106 | 580.33 | 1.277e-14 | 7.766e-5 | 2.1 | 1.8 |
| 109 | 545.67 | 1.197e-14 | 7.355e-5 | 2.1 | 1.9 |
| 112 | 517.81 | 1.12e-14 | 6.86e-5 | 2.2 | 2 |
Table 3 compares measured and calculated extended SSD factors for the radiation field of 10 × 10 cm2 at 9-MeV electron beam energy included in the study. The maximum differences of 0.05% and 1.06% were observed between measurement and MC- *F8 and MC-*F4 calculation, respectively. Absorbed doses resulting from the use of an *F4 volume flux tally method, compared to an *F8 tally using both the photon-electron mode (p, e-mode) were all in agreement.
The results of the measurements, obtained with the inverse slope method, have been compared with those reported from the literature for a 10 × 10 cm2 applicator and the selected 9 MeV energy in Table 4. in early studies of effective SSD, the amount of effective SSD in the mentioned position calculated 83.2 Cm by khan et al. [31] in Toshiba (LMR 13) machine. In the latest studies Rajasekar et al. [32] in Mitsubishi machine and Kim et al. [31] in Varian, calculated SSDeff, respectively 87.2 and 80.6 Cm. As Table 4 depicts, the comparison of virtual SSD obtained in this study with those obtained by other authors as well as suggest that SSDeff is nm dependent and should be measured for each accelerator [33]. It should be pointed out that these differences may be caused by differences within the collimation systems of LINACs as outlined previously. Because collimation system has various beam scattering components and as a result, the SSDeff varies with collimation system in a complex manner [34].
Table 4. Comparison of the measured and calculated effective SSDs of the present study with those of other workers for the 10 × 10 cm2 applicator in 9-MeV energy.
| Authors | Method, devices | Accelerator type | SSDeff |
|---|---|---|---|
| Jamshidi et al. | ISL†, 0.6-cm3 Farmer-type ionization chamber with a 60Co cap | Varian Clinac-2500 | 72.7 |
| Faermann et al. | IS††, 0.6 cc cylindrical ion chamber, model 2571 NE | Varian Clinac 18 | 76.18 |
| Kim et al. | IS, Farmer type chamber (FC 65-G) | iX (Varian) | 80.6 |
| Roback et al. | IS, 0.6-cm3 Farmer ionization chamber | Varian Clinac 2500 | 82.9 |
| Khan et al. | IS, 0.6-ml Farmer ion chamber | Toshiba (LMR 13) | 83.2 |
| Rajasekar et al. | IS, radiation field analyser (RFA-300, Scanditronics) with a p-semiconductor probe | Mitsubishi | 87.2 |
| Roback et al. | IS, 0.6-cm3 Farmer ionization chamber | Varian Clinac 2100C | 88.3 |
| Ravindran et al. | IS, 0.5 cm3 Capintec parallel plate chamber | Siemens Mevatron | 92.2 |
| Cygler et al. | ISL, RK cylindrical chamber (0.12 cc) | Siemens MD-2 | 94 |
| This work | IS, 0.02cc Advanced Markus® electron chamber (TM 34045; PTW) | Siemens ONCOR | 95.59 |
| This work | IS, MCNP5-*F8 | Siemens ONCOR | 95.68 |
| This work | IS, MCNP5-*F4 | Siemens ONCOR | 96.66 |
In the present study, we have simulated 9 MeV electron beams generated from the Siemens Oncore Linac treatment head by MCNP5 transport code. Considering the good agreements between the results of MC-calculated PDD and OAD values with the corresponding measured values and the model simulation was verified. The simulation results show that the differences between measured and calculated values of effective SSD within 1%. Considering the results from three methods of calculation, and comparing the results with experimental methods, it was shown that Monte Carlo simulation is a useful method in determination of electron virtual source position and can be used safely in upcoming dose calculations in uncommon SSD distances encountered in the clinic.
Author’s would like to thank the “Alborz Hospital, Karaj, Iran” for their support.