Research & Reviews: Journal of Pure and Applied Physics
ISSN: 2320-2459
ISSN: 2320-2459
Department of Physics, College of Science, University of Baghdad, Baghdad, Iraq
Received Date: 31/01/2018; Accepted Date: 02/03/2018; Published Date: 08/03/2018
Visit for more related articles at Research & Reviews: Journal of Pure and Applied Physics
SnO2 films were prepared by pluse laser deposition (PLD) technique. The Pulsed Nd:YAG laser was used for prepared SnO2 thin films under O2 gas environment with varying pulse energies. X-ray diffraction patterns and intensity curves for the SnO2 films on glass substrates obtained by PLD technique show that the SnO2 polycrystalline films with all energies. The optical properties of as-grown film such as optical transmittance spectrum, refractive index and energy gap have been measured experimentally and the effects of laser pulse energy on it were studied
Refractive index; Intensity; Evaporation; Deposition; Spectrometer
Tin oxide films (SnO2) have been studied with a focus on application to sensors, transparent electrodes in displays, heat mirrors and transparent conducting oxide (TCO) coatings for solar cells [1-5]. SnO2 films have been prepared by several deposition techniques, such as pulse laser deposition (PLD), photo-MOCVD, reactive evaporation, spray paralysis, sol-gel process, and dc/rf sputtering [6-8]. PLD is the plasma produced by the interaction of high-energy laser pulses with matter in any state of aggregation [9,10]. Laser induced plasmas of metals and alloys are of great interest since they have different attractive and important applications, e.g. material processing, thin film deposition, the synthesis of nanoparticles, the elemental analysis of multi component materials, precision machining, and laser induced breakdown spectroscopy (LIBS), surgery, and laser micro-probe mass spectroscopy [11-13].
Typical Experimental Set-Ups
PLD experiment was carried out under vacuum pressure (6 x 10⁻² mbar by using Varian DS219 Rotary pump). The beam of Nd:YAG laser with second harmonic frequency (ƛ=532 nm, 10 ns, 6 Hz) was focused onto target. The target of the deposition was SnO2 bulk with purity 99.999%, shaped liked disc with a diameter of 1 cm. the target was kept onto rotating holder (speed 4 rev/ min) to prevent fast drilling. The substrate distance from the target was fixed to 2 cm,
The PLD experiment was performed at room temperature and the as-grown samples were not annealed after deposition. PLD setup scheme has been shown in Figure 1. The crystalline structure was examined using X-ray diffraction (XRD). Optical properties (UV/VIS absorption spectrum) of the SnO2 films were performed using. (UV-Visible spectrometer). The laser pulse energy was varied from (400-800) mJ with increment.

Figure 1: Pulsed laser deposition (PLD) system.
X-Ray Diffraction Spectra
The XRD patterns of the SnO2 thin film is given in Figure 1. Figures 2a-2c shows the X-ray diffraction patterns for undoped SnO2 films grown on glass substrates We can be seen that the degree of crystalline and grain size variation with laser energy this can be interoperated in term the improvement the crystal stricture of these films with increasing the laser energy, it seems that all the films are polycrystalline [11]. The grain size (D) of the material; which plays an important role in the material properties, can be estimated easily from the X-ray spectrum by means of full width at half maximum (FWHM) method that is often calculated by Scherrer’s relation [9],

Figure 2a: XRD of SnO2 thin film with Number of shoot=400 and different energies.

Figure 2b: XRD of SnO2 thin film with Number of shoot=600 and different energies.

Figure 2c: XRD of SnO2 thin film with Number of shoot=800 and different energies.
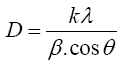
Where λ is the wavelength of X-ray used (1.54 A), βis the full width half maximum (FWHM) of the peak and θ is the glancing angle. The calculated crystalline size (D) of Tin oxide is tabulated in Table 1. The FWHM and the grain size of the samples are shown in Table 1.
Table 1: Thin film and different energies.
| Energies | 2θ (Deg.) | FWHM (Deg.) | dhkl Exp.(Å) | G.S (nm) | hkl |
|---|---|---|---|---|---|
| 400 | 26.22 | 0.219 | 3.3961 | 371 | -110 |
| 32.47 | 0.247 | 2.7551 | 338 | -111 | |
| 38.27 | 0.243 | 2.3499 | 301 | -200 | |
| 50.78 | 0.25 | 1.7965 | 278 | -211 | |
| 58.01 | 0.257 | 1.588 | 246 | -220 | |
| 600 | 26.27 | 0.244 | 3.3879 | 321 | -110 |
| 32.75 | 0.219 | 2.7323 | 316 | -111 | |
| 38.89 | 0.205 | 2.31 | 298 | -200 | |
| 50.31 | 0.149 | 1.8122 | 286 | -211 | |
| 58.27 | 0.114 | 1.5822 | 269 | -220 | |
| 800 | 26.4 | 0.19 | 3.3733 | 327 | -110 |
| 33.1 | 0.183 | 2.704 | 319 | -111 | |
| 83.92 | 0.162 | 2.31 | 267 | -200 | |
| 50.49 | 0.144 | 1.8 | 298 | -211 | |
| 58.6 | 0.165 | 1.574 | 243 | -220 |
UV-Visible Spectroscopy
The optical properties of SnO2 have been determined by using spectrophotometer in the wavelength range (200-1100) nm.
SnO2 thin films were successfully deposited onto glass substrate and the films were very transparent.
Transmittance spectra recorded for SnO2 films as a function of wavelength range (200-1100 nm) at different energies 400, 600, and 800 mJ shown in Figure 3.

Figure 3: Shows the Transition of SnO2 thin films as a function of wavelength.
This Figure 4 show that the transmittance decreases with increasing of energies due to increasing of thicknesses.

Figure 4: Shows the Refractive index of SnO2 thin films as a function of wavelength.
The absorption coefficient (α) is calculated using the equation, [12]
α = ln (1/T)/d (1)
Where T is transmittance and d is film thickness (Figure 5). The absorption coefficient (α) and the incident photon energy (hν) are related by the following equation [13]:

Figure 5: Shows the Reflective of SnO2 thin films as a function of wavelength.
(αhν)2= A (hν-Eg) (2)
The typical plots of (αhν)2 versus hν for SnO2 thin films with (400, 600, and 800) mJ energies deposited on glass substrate is shown in Figure 6. It is observed that increase in energies of laser lead to increase in optical band gap from 2.756 eV to 2.9 eV. This may be associated with variation the crystal structure with laser energies.

Figure 6: Shows the direct electronic transition for nanostructure SnO2 thin films.
In this work we have reported the influence of energies of laser in the structural and optical characteristics of SnO2 thin films.
We describe bellow summarization of our work:
1. The deposition films are having the polycrystalline structure of Tin oxide with cubic structure.
2. The intensity of x-ray diffraction was proportional with laser energies
3. The optical properties was proportional with laser energies.
4. The band gap increase with increasing of laser energies.