Research & Reviews: Journal of Food and Dairy Technology
ISSN: 2321-6204
ISSN: 2321-6204
Mukund Nagarnaik, Arun Sarjoshi, Neeta Phatak, Mangesh Wandhare, Meenal Dhabale, and Girish Pandya*
Research and Development Division, Qualichem Laboratories, Near Gokulpeth Market, Nagpur 440010, India
Received date: 20 February 2014; Accepted date: 22 March 2014; Revised date: 15 March 2014
Visit for more related articles at Research & Reviews: Journal of Food and Dairy Technology
Peanut is one of the popular oil seeds available in India. Peanuts and peanut products are considered as food items among all age groups of population, especially in urban areas. People prefer to buy peanut based food items as snacks. Peanut is shown to be a good substrate for the growth of Aspergiillus sp. and for the production of aflatoxins. Aflatoxins are potent teratogenic, mutagenic, and carcinogenic mycotoxin proven to be contained in food and feed. Present work was carried out as a preliminary study to determine the level of aflatoxin contamination in commercially available roasted and fried peanuts, almonds, cashewnuts and pistacheos collected from commercial markets in Nagpur. The technique used for analysis was HPTLC. Out of 30 samples of peanuts and dry fruits analysed by HPTLC, 24 samples were positive for aflatoxin B1 representing 80.0% with a concentration range of 1.45- 12.0 μg/kg. Quality control and validation was also carried. The detection limits were 0.84 and 2.70 (MDL, LOQ) respectively. The samples contain aflatoxin within the permissible limits.
Aflatoxin B1, HPTLC, Dry fruits, peanuts
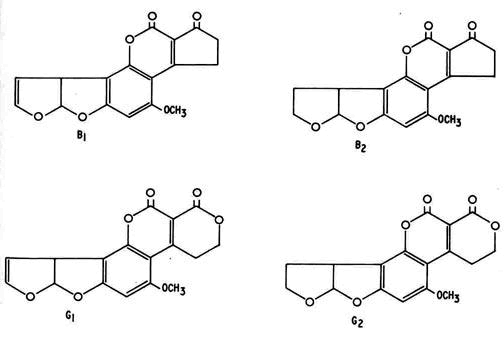
Incidences of food contamination have become increasingly frequent in recent years raising question about their human health and economic consequences. Aflatoxins (AF) are naturally-occurring secondary metabolites of fungal species belonging to strains of the Aspergillus mould such as A. flavus and A. parasiticus. At least 20 different forms of AF exist. The four most common forms of alflatoxin in plant-based foods, in order of highest to lowest toxicity, are B1, G1, B2 and G2. AF B1 is the predominant AF form and the other three forms are rarely seen without some level of B1 contamination.
AF-producing fungi may contaminate fruit, nuts or corn if grown, stored and/or processed under conditions which favour fungal growth. Hot, humid climates and any pest pressures resulting in bruising or cuts on the commodity will favour the growth of the AFproducing fungi, either in the field or in storage. Prolonged storage and/or contamination during storage or transport have also been associated with higher AF levels Another factor affecting the levels of AF in dried fruits specifically is the type of drying method used. There are numerous variations and/or combinations of drying processes used by the food industry depending on the desired characteristics of the finished product, cost, and equipment availability. The typical temperatures in conventional drying processes do not exceed 120 °C and so are too low to cause appreciable aflatoxin degradation. The most commonly used drying method for fruit is sun-drying.
Groundnut (Arachis hypogaea L.), also known as peanut, is the most important legume after beans (Phaseolus vulgaris L.) grown in India. and consumed widely throughout the country . There has been a substantial increase in groundnut production as both a food and cash crop because of increased awareness of their value as a source of protein (23-25% content), fat (40-50%), oil (40-52% content), and 10-20 % carbohydrate depending on the variety [1]. With the costs of animal protein ever increasing, groundnut is becoming an even more important source of protein. A kilogram of groundnuts is high in food energy and provides approximately the same energy value as 2 kilograms of beef, 4 liter of milk, or 36 medium-size eggs. Groundnut seeds are also a nutritional source of vitamin E, niacin, falacin, calcium, phosphorus, magnesium, zinc, iron, riboflavin, thiamine and potassium. Groundnut is consumed raw, roasted, blanched, as peanut butter, crushed and mixed with traditional dishes as a sauce or as binyebwa, a cooked paste.
Investigation of aflatoxin levels in nut products and dried fruits was undertaken because of the human health effects of aflatoxin exposure and the widespread consumption of these products in the Indian market. Frequent monitoring was thus carried out to assess the levels of contaminants in dry fruits and peanuts in commercial markets of Nagpur city. The Food Standard and Safety Authority of India ( FSSA) is responsible for enforcing safety laws and regulations on the production, sale, composition and content of foods and food products as outlined in the Food and Drugs Act & Regulations 2011. It also establishes health-based limits for contaminant residues in food. Tolerances are established as a risk management tool and are generally set only for foods that significantly contribute to the total dietary exposure. The tolerance level for aflatoxin range from 0 to 50 μg/kg under food safety act. In India, a tolerance limit of 30 μg/kg has been prescribed under the Food Safety and Standards( Contaminants, Toxins and Residues) Regulation 2011, for all foods meant for human consumption [2].
Various limits established by International agencies for Aflatoxin is summarized in Table 1.

Table 1: Limits established by International agencies for Maximum level of total aflatoxin in foodstuffs
Peanut and dry fruit samples were randomly collected from different markets of Nagpur city. The samples were collected in sterilized polyethylene bags to avoid further contamination and stored in refrigerator at 5°C till further studies.
Chemicals and reagents
Aflatoxin B1 standard was purchased from Hi-Media, Mumbai. Stock solutions of aflatoxins were prepared in HPLC grade methanol and kept in darkness at -20°C.
Working solutions were prepared immediately before use by diluting stock solution with HPLC grade methanol. Solvents used for HPTLC were of HPLC grade while all other reagents used were of the highest analytical grade available. Five point calibration curves, with triplicate injection, in the working range of 5 to 25 μg/kg Aflatoxin B1 were obtained.
Extraction of aflatoxins from Peanuts and Dry fruits
For detection and estimation of aflatoxins from peanuts and dry fruits samples collected from the city market, the analytical procedure of solvent extraction and subsequent analysis by HPTLC was employed. 5 to 6 g each of dried finely crushed sample was taken in 100ml Erlenmeyer flask containing mixture of methanol and water (60:40v/v) and shaken on horizontal rotary shaker for 4 minutes and allowed to stand for 10 minutes. Thereafter, the mixture was filtered and 20 ml filtrate was taken and mixed with 20ml of 10% NaCl solution and 20 ml petroleum ether and shaken for 2 minutes. The lower aqueous layer was shaken with 50 ml of dichloromethane for 1 minute and allowed to separate. The dichloromethane phase was dried with 5 g sodium sulphate, filtered and evaporated to dryness. The residue was dissolved in 0.5ml of toluene: acetonitrile (98:2) mixture and stored in the darkness for qualitative and quantitative analysis of aflatoxins. All the procedures were carried out in subdued light since aflatoxins are subjected to light degradation.
Qualitative and quantitative estimation of aflatoxins
Qualitative estimation of aflatoxin was done by High performance thin layer chromatography (HPTLC). The analytical equipment for HPTLC (CAMAG Linomat 5 ) with CAMAG TLC Scanner 171005, CAMAG Visualizer 171113 and operated with winCATs software.For the first development, the chamber was filled with diethyl ether upto 5 cm mark. The plate was placed in the chamber and the solvent was allowed to migrate for a 50mm distance. Subsequently the plate was dried and viewed at 366nm.For second development, which separates the aflatoxin, the chamber was filled and saturated with a mixture of chloroform: acetone: water (140:20:0.3) and the plate is inserted. The solvent migrates up to 80mm.The plate is dried and viewed under UV light at 366nm.The plate is scanned at 366nm and aflatoxin concentration calculated.
About 30 samples of nuts and dry fruits consisting of peanuts, cashew nuts, almonds and pistacheos were collected from the local market of Nagpur city. These samples were analysed for Aflatoxin content. The results of analysis are summarized in Table 2. Out of the 10 peanut samples analysed 8 ( 80.0%) tested positive for aflatoxin B1.In case of cashew nuts, 7 tested positive(70%) and for almonds and pistaceous 80 % tested positive for aflatoxin B1.

Table 2: Concentration of Aflatoxin B1 in Nagpur city samples
The aflatoxin contamination is due to ubiquitous prevalence of toxigenic Aspergillus flavus as a natural contaminant in the Nagpur samples. Aspergillus flavus, in spite of being a weak plant pathogen lacks the ability to penetrate the shell of nuts .However, it can gain entry through fairly hard testa into the edible kernel. Aspergillus flavus, moreover, is abundant in tropical environments and has a particular preference for nuts as the substrate. Therefore, aflatoxins are frequently associated with high carbohydrate and high fat food and feed like peanuts and their derived products, almonds, pistachios.Although these nuts and dry fruits are contaminated their levels are within the limits of 30 μg/kg set by FSSAI.
Quality Control
In order to carry out aflatoxin analysis in the laboratory, it was necessary to develop an in-house quality control program for ongoing analysis of spiked samples. Ongoing data quality checks were compared with established performance criteria to meet the performance characteristics of the method. The HPTLC method required validation of all procedures (steps) that were undertaken in the method. This required assessment of linearity, recovery (as a measure of trueness or bias) and precision.
For quantification of components present in the sample on the plate by absorbance in UV or emissions in fluorescence, scanning densitometry was used. Scanner has facilities like multiwavelength scanning, fluorence scanning and spectrum recording for identifying the compounds. The spectrum data has advantage that monochromatic light in the range of 190 – 800 nm can be tuned to the maximum absorbance/fluorescence for the separated compounds. Scanning densitometry is suitable for identification by comparison of profiles of analogue curves of every sample track which incorporate multi wave scanning.UV spectra of separated components is recorded and used for identification. Fluorescence measurements at 366 nm were carried out. Figure 1 summarises the image plot obtained for the standards and the samples for peanut on the same plate.

Figure 1: Image of HPTLC spotting for peanut samples and aflatoxin standards
It is observed that image is an additional feature of TLC because real chromatograms, as obtained in other chromatographic techniques, are also available through densitometry evaluation. The different colors of the individual zones seen on the image acts as an extra dimension. Based on the data from the scan , one can compare the samples at one wavelength. Fig 2 illustrates the three dimensional plot of scan at 366 nm for aflatoxin.

Figure 2: Three dimensional plot of Aflatoxin sample scan at 366 nm for one of the tracks
Five standards in the concentration range 5-25 ug/kg were developed along with the sample on the same plate for calibration curve. A linear calibration curve with coefficient of correlation (r 2) of 0.998 was obtained as illustrated in Figure 3.

Figure 3: Calibration curve of Aflatoxin B 1 (μg/kg) vs. Area in AU
Accuracy was evaluated in terms of recovery by spiking blank samples with the corresponding volume of the aflatoxin working standard solution. Total of seven samples, one on each day, were spiked with a concentration of 2.0 ug/kg. The samples were than processed for analysis by HPTLC. The results of day to day analyses are summarized in Table 3.

Table 3: Quality Control and Uncertainty in Aflatoxin analysis
Recoveries between 87 -120% were found in the samples. The intraday precision was expressed as percent relative standard deviation for each aflatoxin analysed.The RSD obtained was 13.3 %.
Method detection limits (MDL) were also determined for aflatoxin analyzed under this study [3]. It provides a useful mechanism for illustrating the capability of the analytical method. MDLs were calculated for the aflatoxin as follows:
The sample standard deviation is multiplied by the correct Student's t-value from the statistical Tables.
In the present study seven replicates were taken, hence six degrees of freedom was considered. It is found to be 3.143. The MDL was calculated as follows:
MDL= (s)(t-value)= 0.27 x 3.143= 0.84 μg/kg.
Similarly, LOQ was subsequently determined as 10 times the Standard Deviation of the recovered aflatoxin. The limit of quantitation was also calculated as:
LOQ= 10 x (s) = 10 x 0.27 = 2.70 μg/kg
The MDL and LOQ were thus calculated for the aflatoxin B1 under study and are summarized in Table 3.
Attempt was also made to estimate the uncertainty associated with the analytical method by applying a bottom-up approach. All data appearing in this study complies with NABL 17025 requirements. It was implemented in our laboratory as a routine method and our laboratory was accredited. The uncertainty of each step was estimated identifying which of them are relevant in the global uncertainty analysis by a cause and effect technique as illustrated in Figure 4.

Figure 4: Cause and Effect diagram for Aflatoxin analysis
The uncertainty estimation procedure is summarized in Figure 5.

Figure 5: Uncertainty Estimation Process for Aflatoxin
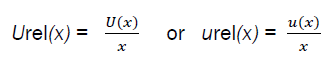
The standard uncertainties associated with each step are quantified by estimating analyte concentration from the calibration curve, calculating recovery of the sample extract. After obtaining the standard uncertainty (u(x)), expressed as a standard deviation, and combined standard uncertainty were determined. In some cases, it is feasible to use relative uncertainties which represent the value of the uncertainty normalized. It is obtained as the quotient between the standard uncertainty u(x) and the value of x:
The uncertainty estimation was carried as per the procedure summarized in Figure 5.
The combined standard uncertainty u (f) is calculated as

Where c is a sensitivity coefficient associated to each one of variables, given by the partial derivative of the function: c(x) = ∂f/∂x.
The different aspects explained above for estimating the combined uncertainties have been applied to aflatoxin analysis. The expanded uncertainty was subsequently determined to develop an interval within which the value of the measurand may lie. A factor of 2 was thus used for obtaining a confidence level of 95%.
The developed method was validated in order to ensure the feasibility of the method for its application in routine analysis.Parameters such as specificity, linearity, quantitation limits, precision, accuracy and robustness were determined. In the specificity analysis representative chromatogram of individual compounds and also in a mixture of interfering analytes was studied. Linearity and working range were demonstrated by analysis of standards three times for different concentrations. The study was made every time with serial dilutions. Linearity demonstrated by plotting graph response against concentration and the curve fitted without forcing to zero. Slope and correlation coefficient were calculated. For detection limit seven replicates of fortified samples were run and their determinations was performed. Estimation of limit of quantification and limit of detection was done by the guideline of estimation of analytical detection limit. For Precision, seven replicates of fortified samples were run for the matrix and their determinations performed. Accuracy in analysis was based on seven replicates i. e. repeatability studies. Intermediate precision obtained on different days (Reproducibility) and relative standard deviation (RSD) is determined. Robustness of analytical method was established by changing the experimental conditions such as temperature.