Research & Reviews: Journal of Food and Dairy Technology
ISSN: 2321-6204
ISSN: 2321-6204
Centre of Food Science and Technology, Institute of Agricultural Sciences, Banaras Hindu University, Varanasi-221005, India
Received date: 24/02/2017; Accepted date: 10/03/2017; Published date: 16/03/2017
Visit for more related articles at Research & Reviews: Journal of Food and Dairy Technology
The aloe vera-mango ready to serve beverage in major ingredient mango (75%), aloe vera (25%) and optimized sugar. During the investigation, the effect different level of time, temperature and TSS was studied by employing a 3 factor. The best formulation with time 23 minute, temperature 76.62°C and 16.5oBrix TSS. The product on the basis aloe vera based the formulation was found to be best appropriatefor manufacture aloe vera-mango RTS beverage. The content of aloe-emodin in beverage shown significant difference before and after manufacturing. The predicted sensory score of 8.10, 7.83, 8.33 and 7.67 for colour and appearance, taste, flavor and consistency respectively, the physic-chemical value 15.53(g/ml), 2.40(g/ml), 13.13(g/ml), 0.26, 3.95, 6.23(mg/ml), 0.21 (mg/ml) and 40.96 (%) for total sugar, reducing sugar, non-reducing sugar, acidity, pH, ascorbic acid, polyphenol and DPPH respectively.
Aloe vera, Mango, RTS beverage, Sensorial attributes, Physicochemical properties, Antioxidant activity
Aloe vera human consumption as a beverage has recently increased in popularity with the number of aloe juice introductions almost doubling since 2010 [1]. This increased consumer popularity is reflected by the shift in market availability of aloe juices from specialty outlets to mainstream groceries and drug stores [2]. Consumer interest in aloe beverages stems from the association of aloe juice with a variety of both anecdotal and experimental research-supported health benefits including the prevention or treatment of various tumors [3,4] and arthritis [5], reduction in symptoms of diabetes [6] enhancement of immunity [7] and decreased cholesterol levels [8].
Aloe barbadensis Miller (Aloe vera) is considered to be the most biologically active of the approximately 420 aloe species identified and characterized till date. Aloe vera contains several biologically active constitents including vitamins, minerals, polysaccharides, amino acids, anthraquinones, saponins, phytosterols and salicylic acids etc. Several research reports credit aloe vera with health benefits viz. antitumour, antidiabetic, hypolipidemic wounds and burns healing activity, ulcer prevention, immunomodulatory and prebiotic properties [9]. Apart from controlling the chemical, functional and physical properties of native aloe vera gel and juice are still a major challenge for its processing. It is due to the microbial, mechanical, enzymatic and structural alterations that happen during different climatic and processing condition [10,11].
Aloe vera emodin is an anthraquinone that has the ability to suppress or inhibit the growth of malignant cancer cells making it to have antineoplastic properties [12].
It has also been reported that the aloe vera extracts possessed antimicrobial activity against bacterial pathogens from gram positive and gram negative. Barbaloin (also named aloin), the C-glucoside of aloe emodin anthrone, localizes in the outer rind of the aloe plant, has been reported to constitute up to 30% of the aloe plants dried leaf exudates and proposed as a part of the defense mechanisms against herbivores [13].
The Mango (Mangifera indica L.) belongs to family Anacardiaceae. Mangoes are considered an excellent table fruit. It is rich source of carbohydrate as well as vitamin A and ascorbic acid. These phenolic compound possess potent antioxidant activity that play an important role in human nutrition as preventative agents against several diseases caused by oxidative stress, protecting the body tissues against oxidative stress with their antioxidant, anti-mutagen, anti-inflammatory, and anti-carcinogenic properties [14]. Apart from the fruit, mango flesh also has been reported to have antilithiatic and free radical scavenging properties, which reduce lipid peroxidation and enhance antioxidant enzymes (superoxide dismutase and catalase) against isoproterenol [15].
Present dietary scenario necessitates exploring the possibility of incorporating novel ingredients in commonly consumed foods rather than developing new food product [16]. Although, mango is rich in nutritional as well as pharmaceutical properties but being an underutilized fruit crop it’s processing is negligible. Therefore, this is very important to standardize the suitable ratio of mango pulp and aloe vera gel for the preparation of a good blended RTS. This may be a better idea to popularize the mango and aloe vera.
Present research was undertaken to optimize production of aloe vera-mango RTS beverage using a statistical software tool namely response surface methodology (RSM). Validation of predicted and actual value was done in order to get the best quality of aloe vera-mango RTS beverage in terms of sensory and functional perceptions. RSM was used earlier to optimize the various parameters in the production of food products with desired quality [17].
Aloe vera leaves were procured from the Department of Botany, Banaras Hindu University, Varanasi and uniformly ripened Neelam mango procured from local market sunderpur Varanasi. Other raw material including sugar, Mango flavour essence, glass bottles were also procured from the local market.
Preparation of Aloe Vera-Mango RTS Beverage
The leaves of aloe vera were sound, undamaged, mold/rot free and matured (3-4 year) in order to keep all the active ingredients in full concentration. The pulp was taken out by the traditional hand filleting method to avoid contamination of internal fillet with the yellow sap. In this method, the lower 1 inch of the leaf base (the white part attached to the large rosette stem of the plant), the tapering point (2-4 inch) of the leaf top and the short, sharp spines located along the leaf margins were removed by a sharp knife, then the knife, was introduced into the mucilage layer below the green rind avoiding the vascular bundles and the top rind was removed. The bottom rind was similarly removed and the rind parts, to which a significant amount of mucilage remains attached, were discarded. This is of critical concern because the highest concentration of potentially beneficial aloe constituents are found in this mucilage, as this layer represents the constituents synthesized by the vascular bundle cells empowered by energy developed in the green (chlorophyll containing) rind cells through sun-induced photosynthesis. The filleting operation must be completed within 36 hours of harvesting the leaves. The pulp was heated to 65 ± 5°C for 15 ± 5°C min. After heating, the pulp was mashed with the hand beater. The mashed pulp was strained with muslin cloth to get aloe vera juice.
The fresh, well ripened Neelam variety of mango was taken and extract to the pulp which later was mixed with aloe vera and mango @ of 25% and 75% respectively. The process flow chart for preparation of aloe vera RTS is shown in Figure 1.

Figure 1: The process flow chart for preparation of aloe vera RTS.
Physicochemical Analysis of Aloe Vera – Mango RTS
The pH values were determined with the help of an electronic pH meter (Thermo Scientific, 2 star), TSS measurement was done with the help of a hand refractometer (Bellingham Stanley Ltd., UK) with detection range: 0-32°C and values expressed as °Brix. Acidity of various samples was determined by titrating against 0.1 N NaOH according to AOAC (1995) method. Ascorbic acid content was determined by the titration method using 2,6-dichlorophenol endophenol dye (C12H7NCl2) as recommended [18]. The total sugar of different trials were determined by Phenol sulfuric Acid - UV method [19] and Reducing sugar was determined by, DNS (Dinitro salicylic acid) method. The total phenolic content was determined by the Folin-Ciocalteau method [20]. The DPPH radical scavenging assay was based on the previous method [21].
Chromatographic Conditions
The HPLC analysis conducted using a Symmetry C-18 (4.6 × 250 mm, 5 μm) column equipped with 5 μl sample loop online UV detector. The gradient method was used for mobile phase. The detection was done at 290 nm. It shows the spectra of methanolic extract of aloe- emodin.
Determination of Sensory Qualities
Sensory quality attributes viz. colour AND appearance, consistency, flavour, taste and overall acceptability of the samples were evaluated using a 9-point hedonic rating test by a panel of six judges by the method recommended by Ranganna.
Statistical Analysis
The experimental data obtained from the design were analyzed by the response surface regression procedure using the following second-order polynomial equation:
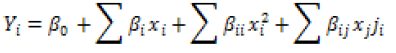
Where Yi was the predicted response, xi xj were independent variables, β0 was the offset term, βi was the linear coefficient, βii was the quadratic coefficient and βij was the interaction coefficient. Analysis of variance (ANOVA) was used to estimate the statistical parameters. The second order polynomial equation was used to fit the experimental data. The significance of the model equation and model terms were evaluated by F-test. The quality of the fit of the polynomial equation was expressed by the coefficient of determination (R2), adjusted and adequate precision. The fitted polynomial equation was expressed as three dimensional surface plots to visualize the relationship between the responses and the experimental levels of each factor used in the design.
Validation
To optimize the level of each factor for maximum response “Point prediction” was employed. The combination of different optimized parameters which gave, maximum response, i.e., optimum TSS content were tested experimentally to see the validity of product.
Standardization of Blends for RTS
In present study, Trial-20 (20 per cent of blend containing 75 per cent Mango pulp and 25 per cent aloe vera gel with different TSS, 0.25 per cent acidity and 70 ppm SO2) was found best for the preparation of blended RTS beverage during organoleptic evaluation however, score given to the best combination of blends by the panel of judges was 8.00 (Table 1). Similarly, Boghani et al. [22] prepared RTS with papaya and aloe Vera juice in different ratio and found that the sample with 5 and 10 percent of aloe Vera juice reached the highest hedonic scores. Our study is also very close to the study of Karanjalker et al. [23] they found that recipe with 70% guava nectar and 30% soymilk has the highest sensory scores.
| R.O. | TIME | TEMP | TSS | C. and A. | TASTE | FLAVO. | CONSIS. | T. Sugar | R. Sugar | N. R.S. | ACIDITY | pH | V.-C | P.PHENOL | DPPH |
|---|---|---|---|---|---|---|---|---|---|---|---|---|---|---|---|
| 1 | 20 | 60 | 15 | 8.6 | 8.2 | 8 | 8.8 | 14.3 | 2.19 | 12.11 | 0.1434 | 4.25 | 3.57 | 0.124 | 23.101 |
| 2 | 15 | 53.18 | 12.5 | 7.8 | 7.8 | 8.6 | 8.6 | 11.5 | 1.76 | 9.74 | 0.1023 | 4.55 | 3.57 | 0.115 | 29.97 |
| 3 | 10 | 60 | 10 | 7.8 | 7.2 | 7.8 | 7.2 | 8.6 | 1.32 | 7.28 | 0.2924 | 4.22 | 2.38 | 0.103 | 24.94 |
| 4 | 15 | 70 | 12.5 | 8.5 | 8.4 | 8.2 | 8.6 | 11.5 | 1.76 | 9.74 | 0.296 | 4.1 | 3.57 | 0.101 | 24.901 |
| 5 | 6.59 | 70 | 12.5 | 7.6 | 7.2 | 5.8 | 8.2 | 11.5 | 1.76 | 9.74 | 0.132 | 4.34 | 3.57 | 0.095 | 23.99 |
| 6 | 10 | 60 | 15 | 8.8 | 7.2 | 7.4 | 8.8 | 14.3 | 2.19 | 12.11 | 0.1152 | 4.28 | 3.57 | 0.123 | 22.92 |
| 7 | 15 | 70 | 12.5 | 8.5 | 8.4 | 8.2 | 8.6 | 11.5 | 1.76 | 9.74 | 0.11 | 4.1 | 3.57 | 0.118 | 24.901 |
| 8 | 23.4 | 70 | 12.5 | 8.8 | 7.0 | 8.2 | 8.8 | 11.5 | 1.76 | 9.76 | 0.1592 | 4.72 | 3.57 | 0.97 | 31.987 |
| 9 | 15 | 70 | 8.29 | 6.4 | 5.8 | 6.4 | 7.0 | 6.0 | 0.92 | 5.08 | 0.192 | 4.25 | 4.76 | 0.453 | 23.61 |
| 10 | 20 | 80 | 15 | 8.2 | 8.2 | 8.9 | 8.8 | 14.3 | 2.19 | 12.11 | 0.1152 | 4.03 | 5.95 | 0.121 | 27.88 |
| 11 | 15 | 70 | 12.5 | 8.5 | 8.4 | 8.2 | 8.6 | 11.5 | 1.76 | 9.74 | 0.196 | 4.1 | 3.57 | 0.101 | 24.901 |
| 12 | 20 | 60 | 10 | 7.2 | 7.4 | 7.2 | 7.2 | 8.6 | 1.32 | 7.28 | 0.2992 | 4.34 | 3.57 | 0.125 | 31.82 |
| 13 | 15 | 70 | 16.7 | 8.8 | 8.6 | 8.8 | 8.8 | 15.5 | 2.38 | 13.12 | 0.259 | 4.34 | 4.76 | 0.163 | 19.00 |
| 14 | 15 | 70 | 12.5 | 8.5 | 8.4 | 8 | 8.6 | 11.5 | 1.76 | 9.74 | 0.1152 | 4.1 | 3.57 | 0.101 | 24.901 |
| 15 | 10 | 80 | 10 | 6.9 | 7.2 | 7.8 | 7.8 | 8.6 | 1.32 | 7.28 | 0.128 | 4 | 3.57 | 0.191 | 16.00 |
| 16 | 10 | 80 | 15 | 8.8 | 8.3 | 8.0 | 8.8 | 14.3 | 2.19 | 12.11 | 0.1024 | 4.66 | 3.57 | 0.0487 | 23.52 |
| 17 | 15 | 70 | 12.5 | 8.5 | 8.4 | 8.2 | 8.6 | 11.5 | 1.76 | 9.74 | 0.196 | 4.1 | 3.57 | 0.101 | 24.901 |
| 18 | 15 | 70 | 12.5 | 8.5 | 8.4 | 8.2 | 8.6 | 11.5 | 1.76 | 9.74 | 0.196 | 4.1 | 3.57 | 0.101 | 24.901 |
| 19 | 15 | 86.81 | 12.5 | 7.6 | 7.8 | 8.2 | 8.2 | 11.5 | 1.76 | 9.74 | 0.1023 | 4.35 | 3.57 | 0.123 | 22.00 |
| 20 | 20 | 80 | 10 | 7.8 | 6.8 | 7.0 | 7.6 | 8.6 | 1.32 | 7.28 | 0.13152 | 4.05 | 4.76 | 0.183 | 25.6 |
Table 1: Response surface methods for the optimization of the aloe vera RTS with mango statistical analysis of the data.
Optimization of Parameters
Table 2 show the optimum levels of the process parameters to obtain the beverage with maximum organoleptic evaluation i.e., colour and appearance, taste, flavour, consistency score and Total sugar, Reducing sugar, non-reducing sugar, Acidity, pH, Vitamin C, Polyphenol, DPPH, respectively by numerical optimization. The contours indicate that when the beverage was prepared with aloe vera (25%), mango(75%) and added sugar according TSS gives the predicted value of maximum colour and appearance (8.1), taste (7.83), flavor (8.33), consistency (7.67) score and Total sugar(15.53 gml-1), reducing sugar (2.4 gml-1), non-reducing sugar (13.13 gml-1), acidity (0.26%), pH (3.95), ascorbic acid (6.23), total polyphenol content (0.21 mgml-1), DPPH activity (40.96%).
| Sample | Sensory Properties | Physicochemical properties | ||||||||||
|---|---|---|---|---|---|---|---|---|---|---|---|---|
| Colour and Appearance | Taste | Flavour | Consistency | Total sugar(g/ml) | Reducing Sugar (g/ml) | Non-reducing sugar (g/ml) | Acidity (%) | pH | Vit.-C (mg/ml) | Polyphenol (mg/ml) | DPPH (%) | |
| A1 | 8.0 | 7.5 | 9 | 8 | 15.5 | 2.38 | 13.12 | 0.259 | 4.34 | 6.664 | 0.2 | 42.78 |
| A2 | 8.5 | 8 | 8 | 7 | 15.6 | 2.45 | 13.15 | 0.27 | 4.0 | 5.95 | 0.22 | 37.81 |
| A3 | 7.8 | 8 | 8 | 8 | 15.5 | 2.38 | 13.12 | 0.25 | 3.5 | 6.069 | 0.2 | 42.28 |
| Am | 8.10 | 7.83 | 8.33 | 7.67 | 15.53 | 2.40 | 13.13 | 0.26 | 3.95 | 6.23 | 0.21 | 40.96 |
Table 2: Physicochemical properties of optimized product of aloe vera-mango RTS.
Colour and Appearance
Some scientists [24] maintain that product appearance is inclusive of product colour and appearance other properties such as physical form (shape, size, and surface texture), temporal aspects movement, etc. and optical properties: reflectance, transmission, glossiness etc. The colour and appearance score was significantly affected by the increase in level of TSS (linear and quadratic term) and directly affected by the amount of aloe vera (25%), mango (75%). The level of TSS 8.29°Brix, in experiment No 9 which scored minimum scores for sensory parameter while the experimental no 6, 8, 13 and 16 high score maximum point (Table 1). The coefficient estimates of color and appearance model (Table 3) showed that the interaction of time and TSS had a positive effect on consistency. It can be seen from Figure 2a that by increasing the level of time, the colour and appearance score in aloe vera-mango RTS has increased rapidly up to 7.5% of TSS at all temperature time but the maximum increment was found at 25 min to similar resulted reported by DuBose et al. [25]. In the statistical analysis color and appearance can be obtained by Equation (1):
| Factor | Coefficient | |||||||||||
|---|---|---|---|---|---|---|---|---|---|---|---|---|
| Colour and Appearance | Taste | Flavour | Consistancy | T.Sugar | R. Sugar | N.R.sugar | Acidity | pH | Ascorbic acid | P.Phynols | DPPH | |
| Constant | 8.493 | 8.392 | 8.163 | 8.6039 | 123.32 | 49.27 | 74.05 | 0.1846 | 4.1070 | 3.574 | 0.1105 | 24.921 |
| A: Time | 0.1112 | 0.0266 | 0.303 | 0.0592 | 0.759 | -0.41 | 1.172 | 0.0071 | 0.0109 | 0.349 | 0.1141 | 2.524 |
| B: Temp | -0.0759 | 0.0366 | 0.046 | 0.0240 | -1.052 | 1.34 | -2.396 | -.0273 | -0.0503 | 0.349 | 0.0060 | -1.698 |
| C : TSS | 0.6397 | 0.5864 | 0.479 | 0.6171 | 28.321 | 11.59 | 16.731 | -0.0192 | 0.0557 | 0.174 | -0.0493 | -0.636 |
| AB | 0.137 | -0.213 | 0.013 | -0.0250 | 0.87 | -1.13 | 2.000 | -0.0023 | -0.0838 | 0.298 | 0.0052 | 0.862 |
| AC | -0.138 | 0.137 | 0.362 | 0.0250 | -0.87 | -1.13 | 0.250 | 0.0038 | -0.1038 | 0.000 | 0.0074 | -1.492 |
| BC | -0.012 | 0.213 | 0.213 | -0.1250 | -0.12 | 1.38 | -1.500 | 0.0364 | 0.0838 | 0.000 | -0.0279 | 2.567 |
| A2 | -0.0597 | -0.4051 | -0.386 | -0.0610 | -1.059 | -1.04 | 0.698 | -0.0118 | 0.1065 | -0.026 | 0.1082 | 0.958 |
| B2 | -0.2365 | -0.1576 | 0.109 | -0.0963 | -0.705 | -0.69 | 0.698 | -0.0271 | 0.0782 | -0.026 | -0.0380 | 0.250 |
| C2 | -0.2719 | -0.3697 | -0.174 | -0.2731 | -6.539 | 2.14 | 0.698 | 0.0164 | 0.0234 | 0.395 | 0.0288 | -1.405 |
Table 3: Coefficients of full second order polynomial model of coded factors for different levels of ingredients in alove vera – mango RTS.

Figure 2a: Interaction of time and TSS on the colour and appearance.
Colour and Appearance = -13.04 + 0.039 A + 0.289 B + 1.543 C - 0.00239 A*A - 0.002365 B*B - 0.0435 C*C+ 0.00275 A*B - 0.01100 A*C - 0.00050 B*C (1)
A = Time, B = Temperature, C = TSS
Taste
The taste score was significantly affected by the increase in level of TSS (linear and quadratic term). The level of TSS 8.29°Brix, in experiment No 9 Which scored minimum scores for sensory parameter while the experimental no 1, 4, 7,11 and 13 high score maximum point (Table 1). The coefficient estimates of color and appearance model (Table 2) showed that the interaction of time, temperature and TSS had a positive effect on taste (P ≤ 0.05). It can be seen from Figure 2b that by decreasing the level of Temperature, the taste score in aloe vera-mango RTS has increased rapidly up to 5.5% of TSS at all temperature but the maximum increment was found at 87.5°C.

Figure 2b: Interaction of temperature and TSS on the taste.
Flavour
The Flavour score varied from 6.4 to 8.8 (Table 1). The minimum score was observed for experiment No. 9 while the maximum score was observed in experiment No. 13. The regression analysis of experimental design demonstrated that the quadratic model term A2 (Time) was significant (p<0.05) and temperature, TSS were positive but not significant which shows that individual factors may not be influencing the sensory properties but it is the interaction between factors which affects a sensory attributes. Figure 2c shows the response surface plot for flavour score as influenced by TSS level. The maximum flavor score appeared to occur with levels of TSS (16.7%). It can be seen from that with increasing level of TSS, the sensory score of flavor in the aloe vera-mango RTS increased rapidly up to 7.5% of TSS at all level of heating time. A sharp convergence of the curve near the boundary explains that increase of TSS and heating time above certain limit would not contribute to increase in sensory attributes. Flavour scores increased by increasing level of total solids.

Figure 2c: Interaction of time and TSS on the flavour.
Consistency
The consistency score was significantly affected by the increases total soluble solid (TSS). The level of TSS 8.29 oBrix in experiment No 9 which scored minimum scores for sensory parameter while the experiment No. 1, 6, 8, 10, 13 and 16 having scored maximum point (Table 1). The coefficient estimates of consistency model (Table 2) showed that the Time, Temperature and TSS had a positive effect on consistency. It can be seen from Figure 2d that by increasing the level of Temperature, the consistency score in aloe vera-mango RTS has increased rapidly up to 7.5% of TSS at all temperature but the maximum increment was found at 87.5°C. In the statistical analysis, consistency can be obtained by Equation (2):

Figure 2d: Interaction of temperature and TSS on the consistency.
Consistency = -11.45 + 0.095 A + 0.2073 B + 1.659 C -0.00244 A*A - 0.000963 B*B –0.04370 C*C - 0.00050 A*B + 0.00200 B*C- 0.00500 B*C (2)
A = Time, B = Temperature, C = TSS
Total Sugar Content
The total sugar of product during chemical analysis was significantly affected by total soluble solid (TSS). The highest total sugar (15.5 g/ml) of product was found trial no. 13 where TSS content was 16.7°Brix. Whereas minimum total sugar (6.0 gml-1) was found in trail no. 9 where TSS was 8.29°Brix (Table 1). Total sugar was rapidly increased with TSS content while it was increasing very slowly or negligible with heating time. As shown in graph Figure 3a. In the statistical analysis, total sugar can be obtained by Equation (3). Mango pulp contains 13.81% total sugars and only 2.55% reducing sugars and the difference is 10.69% as nonreducing sugar. That was in agreement with the results obtained by Kansci et al. [26].

Figure 3a: Interaction of time and TSS on the total sugar.
Total sugar = -5.56 - 0.0545 A - 0.0636 B + 2.015 C + 0.00182 A*A + 0.000454 B*B- 0.03516 C*C - 0.000000 A*B + 0.00000 A*C - 0.00000 B*C (3)
A = Time, B = Temperature, C = TSS
Reducing Sugar
The reducing sugar of product during chemical analysis was significantly affected by total soluble solid (TSS). The highest reducing sugar (2.38 g/ml) of product was found trial no.13 where TSS content was 16.7°Brix whereas minimum reducing sugar (0.92 g/ml) was found in Trail no. 9 where TSS was 8.29°Brix. Table 1 reducing sugar was rapidly increased with TSS content while it was decreasing very slowly or negligible with heating time. As shown in graph Figure 3b. In the statistical analysis, reducing sugar can be obtained by Equation (4):

Figure 3b: Interaction of temperature and TSS on the reducing sugar.
Reducing sugar = -0.793 - 0.0086 A - 0.01001 B + 0.3008 C + 0.000286 A*A + 0.000072 B*B - 0.005078 C*C - 0.000000 A*B + 0.000000 A*C + 0.000000 B*C (4)
A = Time, B = Temperature, C = TSS (Total soluble solid)
Non-Reducing Sugar
The non-reducing sugar of product during chemical analysis was significantly affected by total soluble solid (TSS). The highest non-reducing sugar (13.12 g/ml) of product was found trial no.13 where TSS content was 16.7°Brix. Whereas minimum non-reducing sugar (5.08 mg/ml) was found in Trail no. 9 where TSS was 8.29°Brix (Table 1). The non-reducing sugar was rapidly affected with TSS while it was no interaction with temperature (Figure 3c). In the statistical analysis, non-reducing sugar can be obtained by Equation (5):

Figure 3c: Interaction of temperature and TSS on the non-reducing sugar.
Non-reducing sugar = -4.77 - 0.0459 A - 0.0536 B + 1.714 C + 0.00153 A*A + 0.000383 B*B - 0.03008 C*C - 0.000000 A*B + 0.00000 A*C + 0.00000 B*C (5)
A = Time, B = Temperature, C = TSS (Total Soluble Solid)
Titratable Acidity
The acidity of product during chemical analysis was significantly affected by Temperature and total soluble solid (TSS). Acidity was found highest with Trial no. 12, having, temperature 60°C and TSS 10°Brix which is also relevant with Trial no. 2 and 3 (Table 1). It is found that as increase in temperature and TSS, acidity decreases as shown in Figure 4a. In the statistical analysis, Acidity can be obtained by equation (6). Acidity in aloe vera gel was 0.10 and pH was 4.33, these results were similar to the results [27] and Acidity in mango pulp was 0.41 and pH was 3.85, these results were similar to the results of [26] Equation 6:

Figure 4a: Interaction of temperature and TSS on acidity.
Acidity = 0.71 + 0.0150 A + 0.0178 B - 0.180 C - 0.000473 A*A- 0.000271 B*B + 0.00263 C*C - 0.000047 A*B + 0.00031 A*C+ 0.001455 B*C (6)
A = Time, B = Temperature, C = TSS (Total Soluble Solid)
pH Value
Figure 4b clearly indicate that TSS doesn’t have large variation on pH of product. However temperature has significant effect on TSS. With increase in time till 15 min. pH decreases slowly but after 15 min, increase in time pH increases rapidly. The maximum pH was found in trail no. 8 (time 23 min., TSS 12.5°Brix) and minimum pH was found Trial no.15 (time 10 min, TSS 10°Brix) Table 1. The pH and percent acidity values were similar to the results reported by Hernandez, et al. [28] Equation (7):

Figure 4b: Interaction of temperature and TSS on the pH.
pH = 9.14 + 0.095 A - 0.1312 B - 0.181 C + 0.00426 A*A + 0.000782 B*B+ 0.00374 C*C - 0.00167 A*B -0.00830 A*C + 0.00335 B*C (7)
A = Time, B = Temperature, C = TSS (Total Soluble Solid)
Total Polyphenols Content
The concentration of polyphenol decreases slightly on heating up to 18 min and after that in increases rapidly with increase in time. TSS has very low effect on polyphenol concentration i.e., it decreases slowly till TSS reached 15°Brix and after that polyphenol increases with TSS (Figure 4c). Trial no. 8 (Time 23min. and TSS 12.5°Brix) has highest concentration of polyphenol (0.97 mg/ml) while Trial no. 16 (time 10 min. TSS 15°Brix) has lowest polyphenol concentration (0.0487 mg/ml) (Table 1). The phenolic phytochemicals may contribute to these beneficial health effects because many of these compounds have shown antioxidant activity that may help cells against oxidative damage caused by free radicals [29].

Figure 4c: Interaction of time and TSS on the total polyphenols.
DPPH Activity
Temperature and TSS have better impact on DPPH activity. With increase in temperature, DPPH activity decreases constantly. Similarly TSS has direct relation with DPPH activity as shown in Figure 4d. Trial no. 8 (Temp 70°C, TSS 12.5°Brix) showed highest DPPH activity (31.987 per cent) whereas Trial no. 15 (Temp 80°C, TSS 10°Brix) as lowest DPPH activity (16 per cent) given in Table 3.The antioxidant activity of RF is higher compared to lychee, mango and longan, while the value for WF was lower than that of other tropical fruits such as guava, mango steen, papaya, star fruit and water apple [30]. However, the total phenol content of strawberries [31] attributed to generation of browning compounds (melanoidins) by maillard reaction due to heat treatment that shows potent antioxidant activity [32].

Figure 4d: Interaction of temperature and TSS on the DPPH.
HPLC Study
HPLC Chromotogram of aloe-emodin in pure aloe vera juice and prepared aloe-vera-mango were shown in Figures 5a and 5b respectively. The retention time of aloe-emodin 3.09 min of pure aloe vera and 3.06 min retention time of aloe vera-mango RTS.

Figure 5a: Chromatogram of MeOH extracted aloe-emodin in aloe vera- mango RTS.

Figure 5b: Chromatogram of MeOH extracted aloe-emodin in aloe vera juice.
In 20 trials of aloe vera-mango RTS, the optimized product composition is the best that has organoleptic score i.e., colour and appearance (8.1), taste (8.7), flavor (8.33) and consistency (7.67). The chemical composition of RTS has improved by mingling mango and aloe vera. The nutritive value of the improved RTS has- sugar (15.53%), acidity (0.26%), ascorbic acid (6.23 mg/ml), polyphenol (0.21 mg/ml), DPPH (40.66%) and pH 3.95. It contains antioxidant, aloe-emodin and some enzymes which enhance medicinal properties of RTS. Antimicrobial activity is found in aloe vera which raises shelf life of RTS.